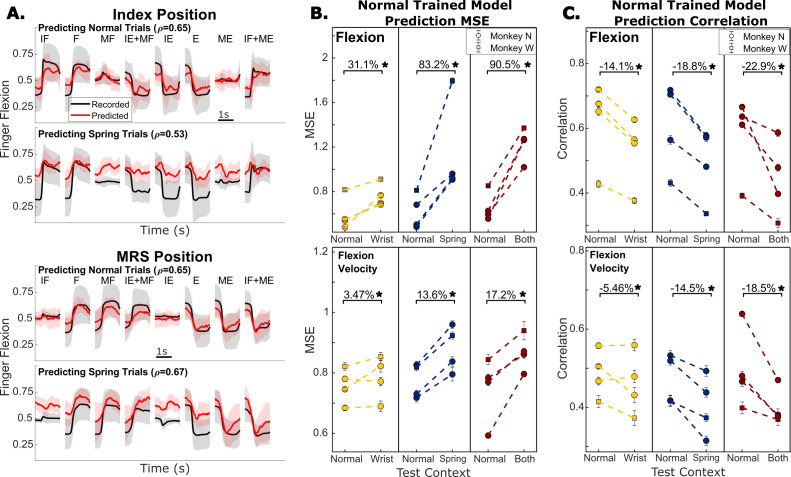
Figure 4. Offline predictions of kinematics.
(A) Recorded and predicted position traces for index finger position (top) and middle-ring-small (MRS) finger group position (bottom), averaged across all trials toward each target. Shading represents one standard deviation. Predictions are from a model trained only on normal trials and the model is evaluated either on normal trials or trials with springs present. r indicates the linear correlation coefficient between recorded and predicted finger positions using all trials in the specified context for that session, excluding the normal context trials used for training the model where applicable. (B) Change in prediction mean-squared error (MSE) when a model trained on normal trials is evaluated on trials in a different context. Color indicates which context is being tested, yellow is wrist, blue is spring, and both is red. Each dashed line and pair of dots represent one session during which the same model was used for both measurements. Error bars on the dots indicate one standard deviation for model performance calculated with 10-fold cross-validation. (C) Same as (B) but model performance is measured with prediction correlation.

