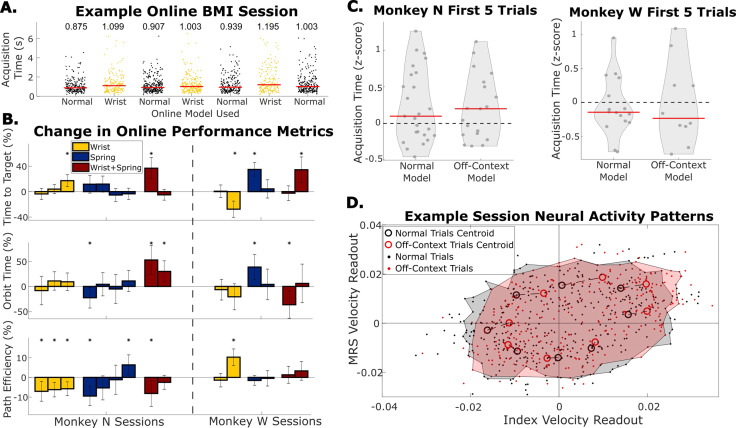
Figure 6. Online performance when context changes were tested by using decoders trained with normal training data or off-context training data.
(A) Example online session in which the wrist context was tested. Each dot indicates acquisition time of one trial, and each grouping of dots is a series of trials before the context was changed. Red bars and numbers above each grouping illustrate the median acquisition time (in seconds) for that series of trials. (B) Change in performance metrics between normal online trials and online trials with the context change indicated by the bar color. Each bar represents one session where off-context online trials are compared to the normal online trials immediately before and after them. Error bars indicate 99% confidence interval in performance metric change. The dashed line separates Monkey N sessions from Monkey W sessions. (C) Average acquisition time during the first five trials each time online trials were started, split between trials performed with the model trained on normal trials and the model trained on off-context trials. Acquisition times were z-scored within a series of trials with the same model. Red lines indicate the median. (D) Neural activity patterns for one example session. Neural activity patterns are velocity predictions at the time point of peak brain-machine interface (BMI) movement using a single linear regression model trained on normal offline trials. Each dot indicates the readout velocity for one trial using the same linear model but for either a normal trial (black) or an off-context trial (red). Larger open circles indicate the centroid of velocity readouts for trials to one of eight target directions split by normal vs off-context trials. Shaded areas bound patterns for all trials excluding trials outside the 95th percentile of index or middle-ring-small (MRS) velocities.


