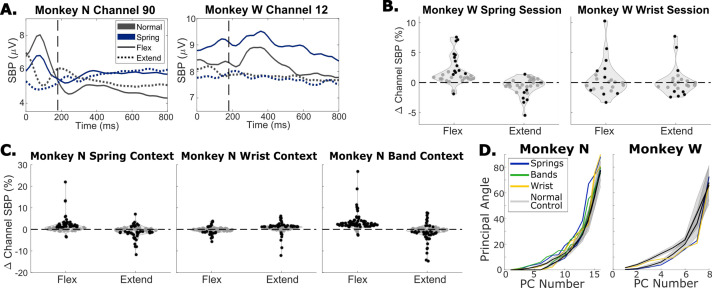
Figure 7. The impact of context changes on neural activity.
(A) Trial-averaged spiking band power (SBP) for two channels during a spring session for each monkey. Trials were aligned to peak movement before averaging, vertical dashed lines indicate peak movement. Black traces show normal trials, blue traces show trials with springs present, solid traces are flexion trials, and dotted traces are extension trials. (B) Change in average SBP in a window around peak movement for each tuned channel for a spring session (left) and wrist session (right), both for Monkey W. Black dots indicate significant differences according to a two-sample t-test (p<0.01). (C) Same as (B) but for Monkey N and using one session where the task was performed normally and in the spring, wrist, and rubber band contexts. (D) Principal angles between the PCA space calculated for normal trials and the PCA spaces calculated for spring trials (blue), band trials (green), or wrist trials (yellow). Black lines are average angles between PCA spaces for two random sets of normal trials, with gray shading indicating one standard deviation.

