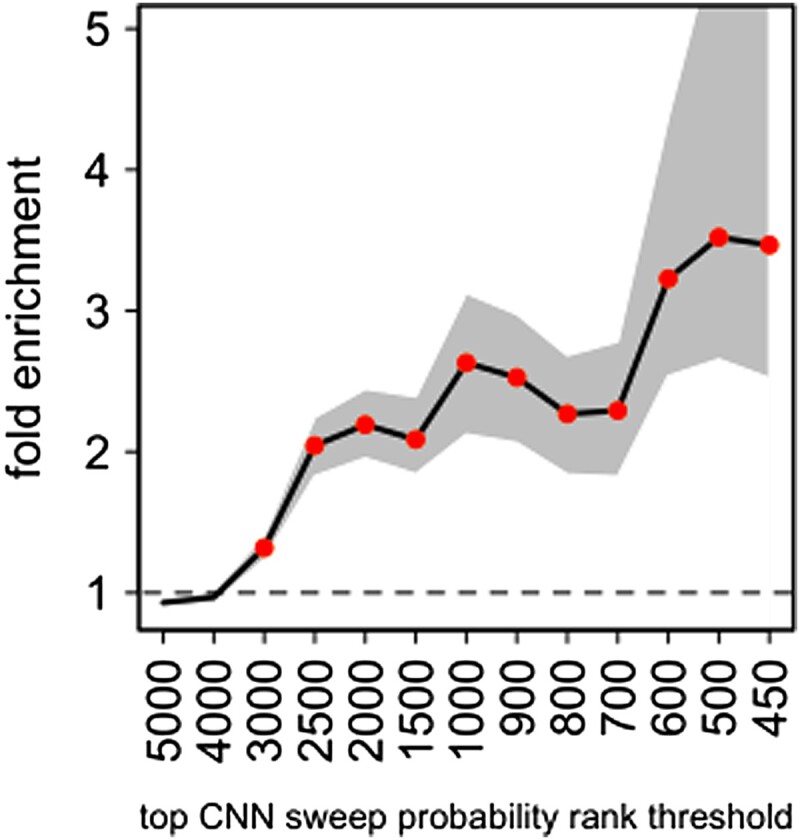
Fig. 7.

Flex-sweep sweep enrichment at VIPs relative to control non-VIPs. The number of VIPs in sweeps is compared with the average number in random control sets of non-VIPs for increasing CNN sweep confidence rank thresholds. A gene (VIP or non-VIP) was considered to be subject to a sweep if its genomic center of the gene was covered by at least one window classified as a sweep. The x-axis represents the stringency of candidate genes considered, from lower stringency (more genes considered) on the left to higher stringency (fewer genes considered) on the right. Stringency is determined by ranking the genes in order of sweep confidence and choosing the top X ranked. The y-axis represents the fold enrichment of VIPs compared with control non-VIPs in the group of candidate genes, on average across all sets of non-VIPs, as described in Enard and Petrov 2020. Multiple neighboring VIPs in the top X may only represent one sweep, but this clustering is accounted for in the FDR estimation as previously described (Di et al. 2021). Shaded area: 95% confidence interval of the fold enrichment. Points: fold enrichment test P < 0.001.
