
Figure 7.
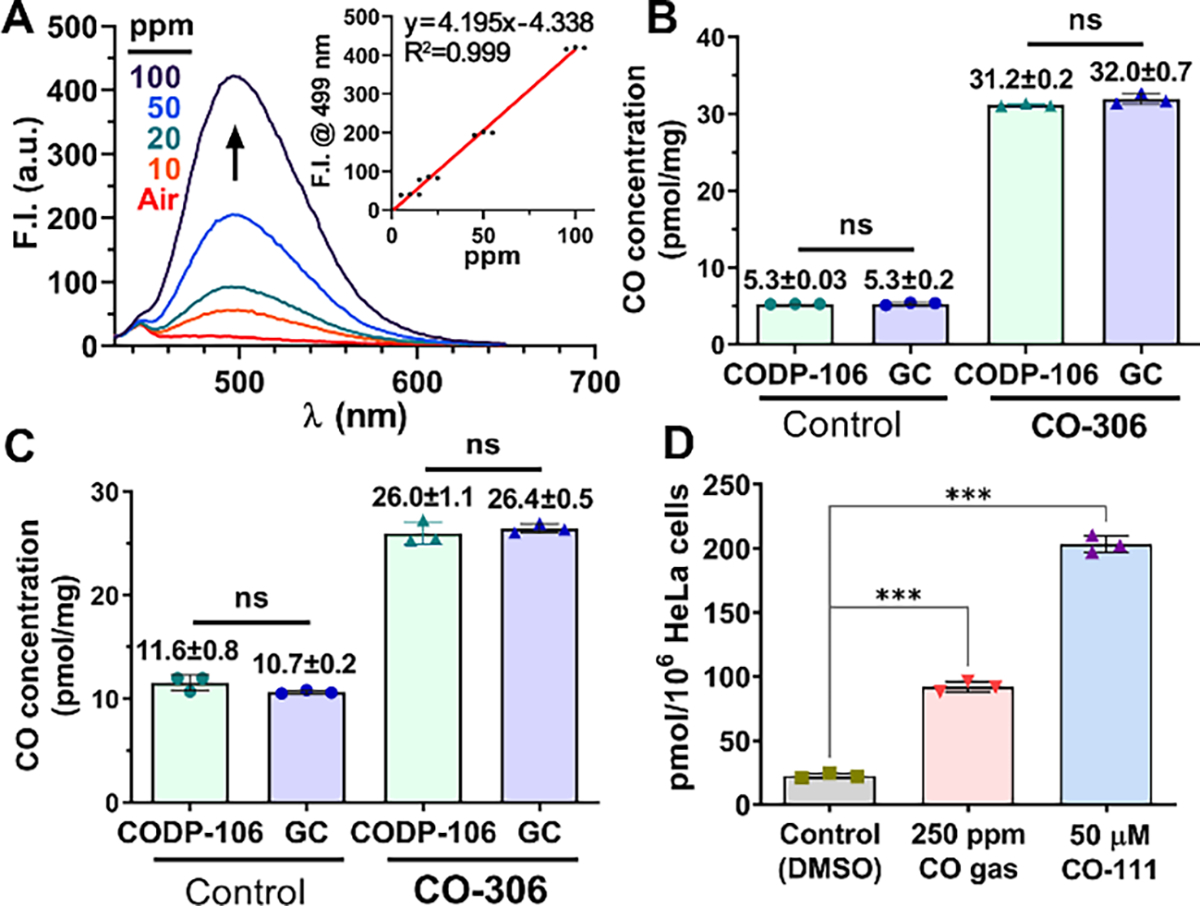
(A) Fluorescence spectra of 1 mM CODP-106 in DMA incubated with 10–100 ppm CO calibration gas; insert: calibration curve of CO concentration (ppm) vs. fluorescence intensity at 499 nm (λEX = 385 nm); CO concentrations of the liver (B) and kidney (C) tissues of mice dosed with or without CO-306 (200 mg/kg) determined by CODP-103 and methanizer-FID-GC; (D) CO concentrations in HeLa cells treated with CO gas or a CO prodrug, CO-111 (50 μM), for 2 h and tested with CODP-106. For B-D, results shown as average ± SD (n = 3), ***P<0.001, ns: not significant (P>0.05), t-test.