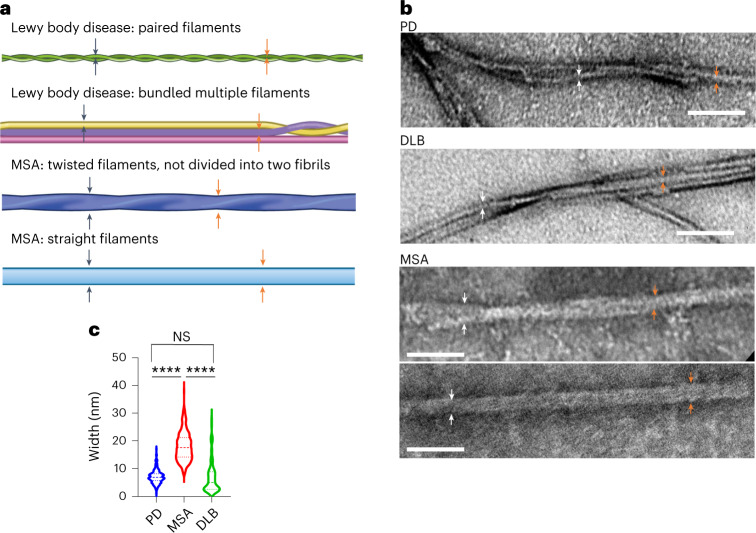
Fig. 2. Structural differences between products of serum IP/RT-QuIC derived from participants with LB diseases or MSA.
a, Schematic view of the main morphology of serum IP/RT-QuIC products derived from patients with LB diseases and MSA. Arrows indicate the measurement sites. b, Negative-stained TEM images of serum IP/RT-QuIC products derived from patients with PD, DLB and MSA. c, Violin plots show the range and average distribution. Statistical analysis was performed using one-way ANOVA followed by Tukey’s correction, resulting in significances of P < 0.0001 (****) among PD, DLB and MSA (PD versus MSA, P < 0.0001; PD versus DLB, P = 0.9514; MSA versus DLB, P < 0.0001). We measured the widths of 10 fibrils and took measurements at two sites for each fibril (PD (n = 50), MSA (n = 25), DLB (n = 9)). Scale bars, 100 nm. NS, not significant.

