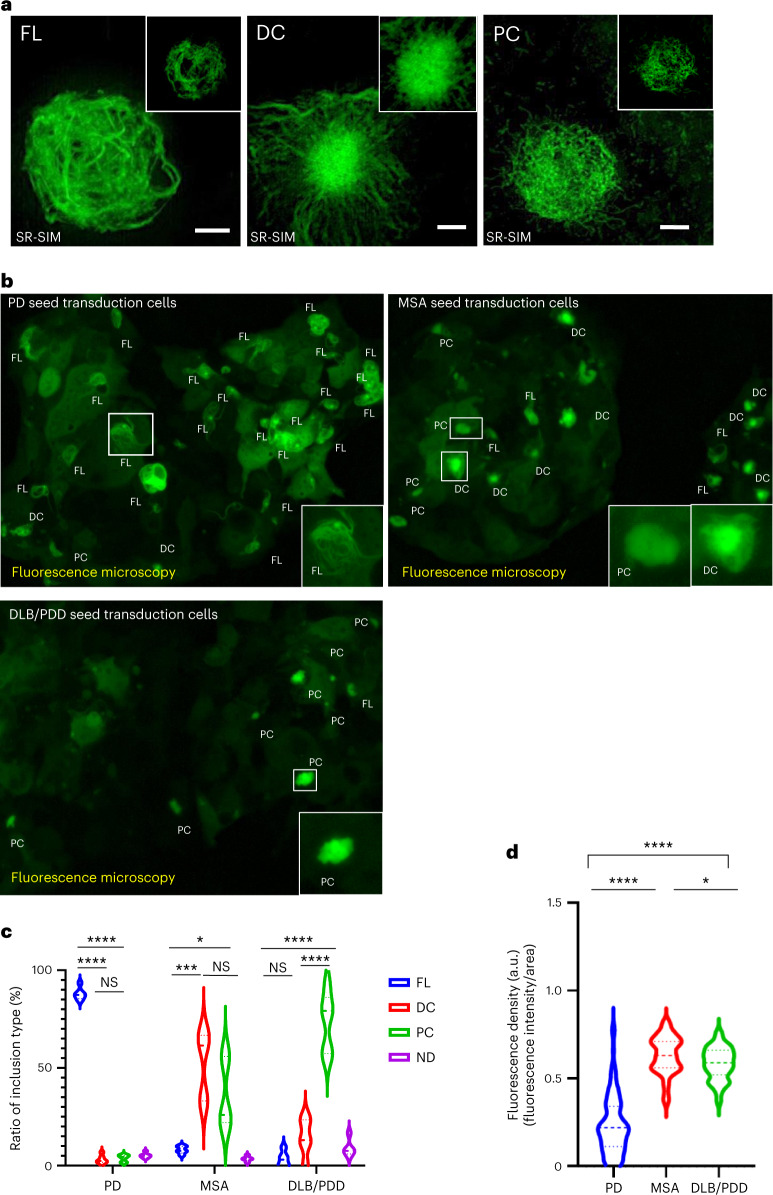
Fig. 3. Serum IP/RT-QuIC-amplified α-synuclein seeds from participants with PD, MSA and DLB/PDD induce intracellular inclusions with distinct morphologies.
a, Intracellular α-synuclein inclusions generated by serum IP/RT-QuIC products derived from patients with PD, MSA and DLB are visualized using SR-SIM. Representative morphologies of GFP-fused α-synuclein A53T inclusions generated by each disease-derived seed transduction in 293-SynG cells are shown. There are three different morphologies, including fibrous (FL), dense-core (DC) and pale-core (PC) inclusion (n = 5 different samples). The inset shows a single layer of the center slice of the inclusions. Scale bars are 2 μm, and the inset sides of the square are 10 µm. b, Images using BZ-X810 are generated as the full-focus image based on 10–20 z-stack images with 3-µm steps with a ×40 objective lens, and insets represent magnified images of inclusions in the square. Representative low-resolution images of 293-SynG cells transduced with each disease-derived seed. c, Violin plots indicate the ratio of each type of inclusion in five (MSA and DLB/PDD) or six (PD) independent low-resolution images obtained from each disease-specific seed transduced cell and evaluated in a blinded manner by three independent examiners as indicated. Statistical analysis was performed using a two-sided one-way ANOVA followed by Tukey’s correction, resulting in significances of P < 0.05 (*), P < 0.001 (***) and P < 0.0001 (****) among FL, DC, PC and ND among each synucleinopathy (PD: FL versus DC, P < 0.0001; FL versus PC, P < 0.0001; DC versus PC, P = 0.9596; MSA: FL versus DC, P = 0.0002; FL versus PC, P = 0.0131; DC versus PC, P = 0.2351; DLB/PDD: FL versus DC, P = 0.3194; FL versus PC, P < 0.0001; DC versus PC, P < 0.0001). d, The fluorescence density of intracellular α-synuclein inclusions, which was calculated as low-resolution fluorescence intensity of inclusion bodies divided by the area of inclusions, generated by seeds derived from patients with PD, MSA and DLB/PDD (PD versus MSA, P < 0.0001; PD versus DLB/PDD, P < 0.0001; MSA versus DLB/PDD, P = 0.0254) (n > 20 for each group). Violin plots show the range and average distribution. Statistical analysis was performed using a two-sided one-way ANOVA followed by Tukey’s correction, resulting in significances of P < 0.0001 (****) and P < 0.05 (*) among PD, MSA and DLB/PDD. ND, not determined; NS, not significant.

