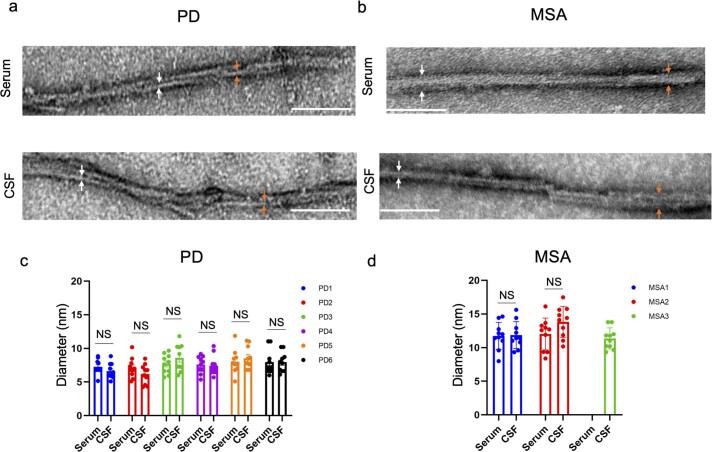
Extended Data Fig. 2. Morphological analysis of amplified products derived from the serum and CSF of PD and MSA cases.
(a-d) Negative-stained transmission electron microscopy images of α-synuclein fibrils derived from serum and CSF by IP/RT-QuIC and RT-QuIC, respectively. (a) PD (case 2) and (b) MSA (case 2). The arrows indicate the measurement sites of the width. Scale bars are 100 nm. The widths of the amplified α-synuclein fibrils are shown for all (c) PD (n = 6: case 1, p = 0.5590; case 2, p = 0.7981; case 3, p = 0.7238; case 4, p = 0.7915 ; case 5, p = 0.3705; case 6, p = 0.6793) and (d) MSA cases (n = 3: case 1, p = 0.5801; case 2, p = 0.6237). The data represent mean ± SEM. Statistical analysis was conducted using a two-tailed t-test. We measured the width of 10 fibrils at two sites for each fibril. CSF, cerebrospinal fluid; MSA, multiple system atrophy; NS, not significant; PD, Parkinson’s disease.

