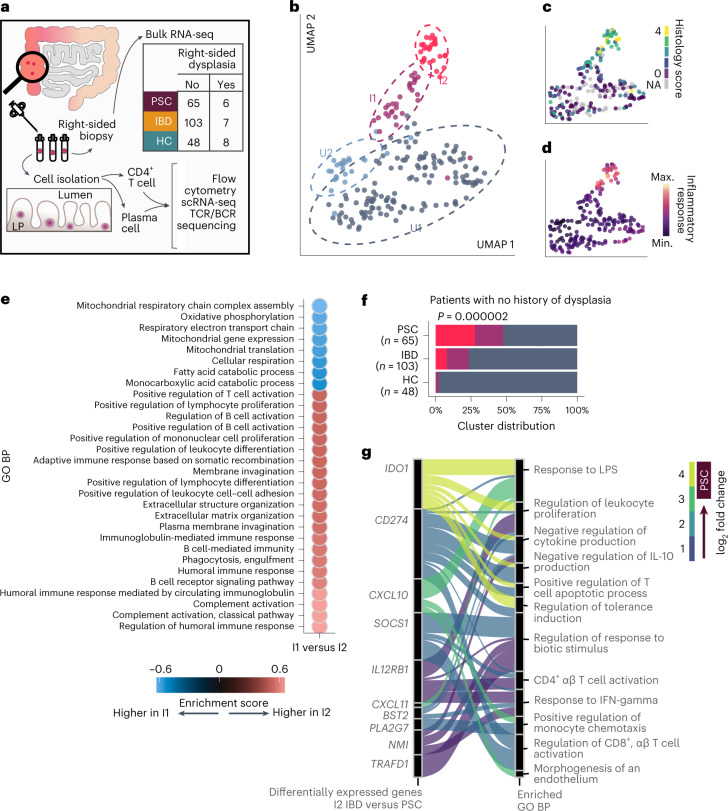
Fig. 1. A subset of patients with PSC with no history of dysplasia show a unique and highly inflamed transcriptional profile.
a, Graphical representation of the methodology of this study. To control for biological differences across the span of the colon, we collected 8–10 tissue biopsies only from the right colon. Our patient cohort included patients with PSC, patients with IBD with a history of right-sided colitis and patients with no history of IBD or PSC (HCs). Patients were retrospectively determined to have right-sided dysplasia. From one biopsy, we isolated RNA for whole-tissue bulk RNA-seq. The remainder of the biopsies were mechanically and enzymatically disrupted to isolate lamina propria CD4+ T cells and plasma cells for analysis via flow cytometry, scRNA-seq, and TCR and B cell receptor (BCR) analysis. b–d, Uniform manifold approximation and projection (UMAP) plots using right colon tissue samples from individuals with no history of dysplasia at the time of sample collection (n = 65 with PSC, n = 103 with IBD, n = 48 HCs). Samples are annotated by transcriptionally determined cluster (b), histologically scored inflammation (c) or inflammatory response gene set enrichment score (d). e, Dot plot showing the top 30 most significantly enriched GO biological processes (BPs) (GSEA test q < 0.1 × 10⁻⁹) between the I2 and I1 clusters; the color represents the enrichment score and direction of effect. f, Distribution of individuals across clusters among individuals without dysplasia; statistical significance was determined using a chi-squared test. Red corresponds to cluster I2, purple to cluster I1 and blue to cluster U (combined U1 and U2). g, Alluvial plot connecting the top enriched GO BPs with the significantly upregulated genes in I2 PSC versus I2 IBD; connections are colored according to fold change. Max., maximum; min., minimum.

