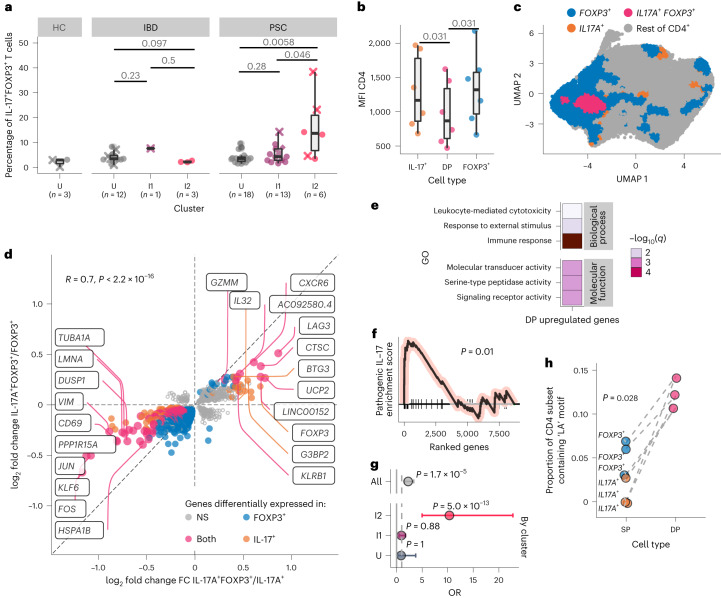
Fig. 3. PSC inflammation is characterized by IL-17A+FOXP+ CD4 T cells enriched for TCRs containing LA.
a, Percentage of right colon lamina propria CD4 T cells positive for IL-17A and FOXP3 (n = 6 PSC I2, n = 13 PSC I1, n = 18 PSC U, n = 3 IBD I2, n = 1 IBD I2, n = 12 IBD U, n = 3 NC U). Significance was determined using a double-sided Wilcoxon rank-sum test without adjustment for multiple comparisons. The ‘x’ denotes patients with dysplasia at the time of sampling. b, Mean fluorescence intensity (MFI) of surface CD4 expression of cells from patients in the I2 PSC group (n = 6). Significance was determined using a double-sided Wilcoxon matched-pairs signed-rank test without adjustment for multiple comparisons (n = 6). The center line represents the median; the hinges indicate the first and third quartiles; the upper and lower whiskers extend to the largest and smallest values that are within 1.5 times the IQR from the first and third quartiles, respectively (a, b). c, UMAP of CD4 T cells from patients with PSC, annotated according to cell type (n = 15 patients, n = 25,942 cells). d, log2 fold change of gene expression comparing DP to FOXP3+ CD4 T cells (x axis) or IL17A+ CD4 T cells (y axis) among I2 PSC individuals (n = 4 patients with PSC I2). Each gene is a circle colored if significantly (P < 0.1) changed across a comparison. NS, not significant. The highest fold change genes are labeled on the graph. e, Most significantly enriched gene sets upregulated in DP CD4 T cells versus either IL17A+ or FOXP3+ CD4 (n = 4 patients with PSC I2). f, Enrichment plot for a pathogenic IL-17 signature based on ranking the genes on their changes in expression in DP CD4 versus IL17A+ CD4 cells. The GSEA nominal P value is shown (n = 4 patients with PSC I2). g, Top and bottom 10% of DP cells by enrichment for pathogenic IL-17 signature were identified and ORs of top vs bottom 10% by cluster are presented as a Forest plot with the 95% confidence intervals and labeled P value (Fisher exact test). (I2, I1 or U, n = 15 PSC patients, n = 25,942 cells). h, Proportion of I2 PSC TCRβ chains containing the LA motif (n = 4). The dashes denote values from the same patient. Significance was determined using a double-sided, unpaired Wilcoxon rank-sum test.

