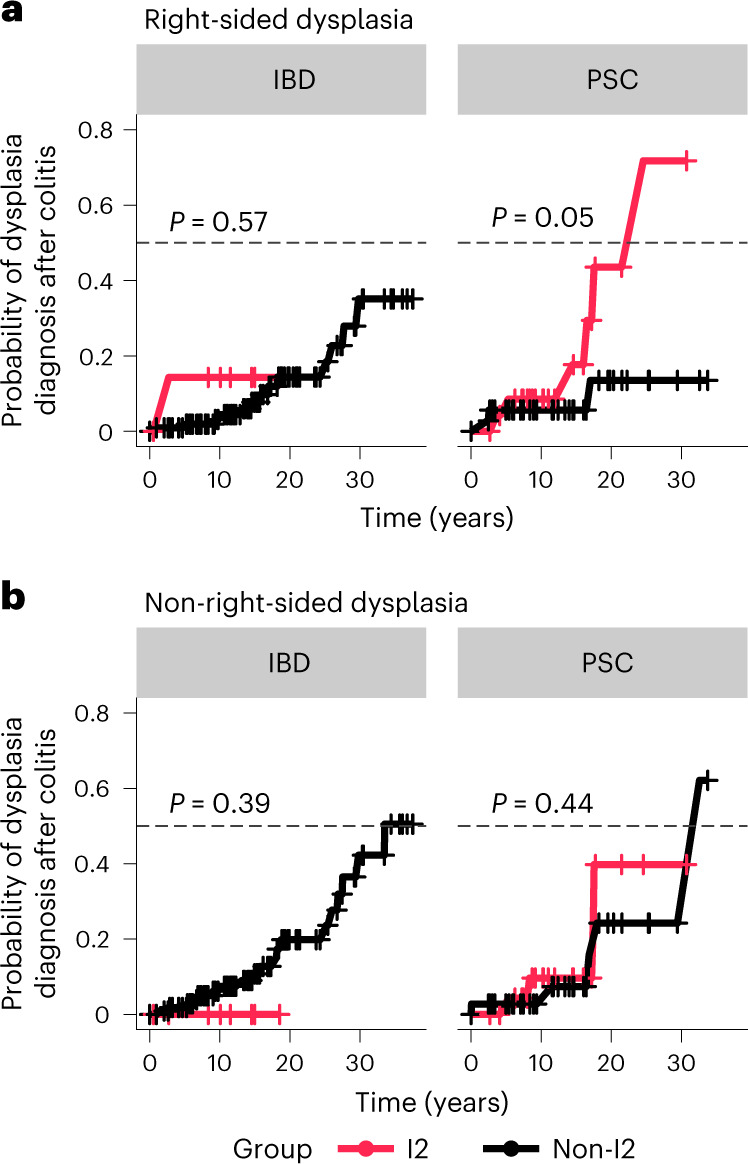
Fig. 5. I2 status is associated with a greater risk and shorter time to dysplasia in PSC but not IBD.

a, Kaplan–Meier-estimated curves for the risk of right-sided dysplasia over time. Patients were classified as I2 (red) or non-I2 (I1 or U, black), according to their transcriptional cluster (n = 64 PSC, n = 127 IBD). The gray dashed line marks the 0.5 probability of the event (dysplasia diagnosis after colitis). For patients who were sampled at multiple time points, they were classified as I2 if at any point they had an I2 signature, otherwise they were classified as non-I2. Time (years) was calculated from the diagnosis of intestinal colitis to either the first incidence of right-sided colitis or the last colonoscopy recorded. Patients are subset according to diagnosis, that is, IBD (left) or PSC (right). b, Kaplan–Meier curves as in a, but showing the risk of non-right-sided dysplasia over time (n = 64 PSC, n = 127 IBD). Statistical outliers for time of follow-up were removed from the analysis before calculating the Kaplan–Meier estimates and P value. Individuals are subset according to diagnosis, that is, IBD (left) or PSC (right). Censored points (no dysplasia diagnosed) are marked as +.
