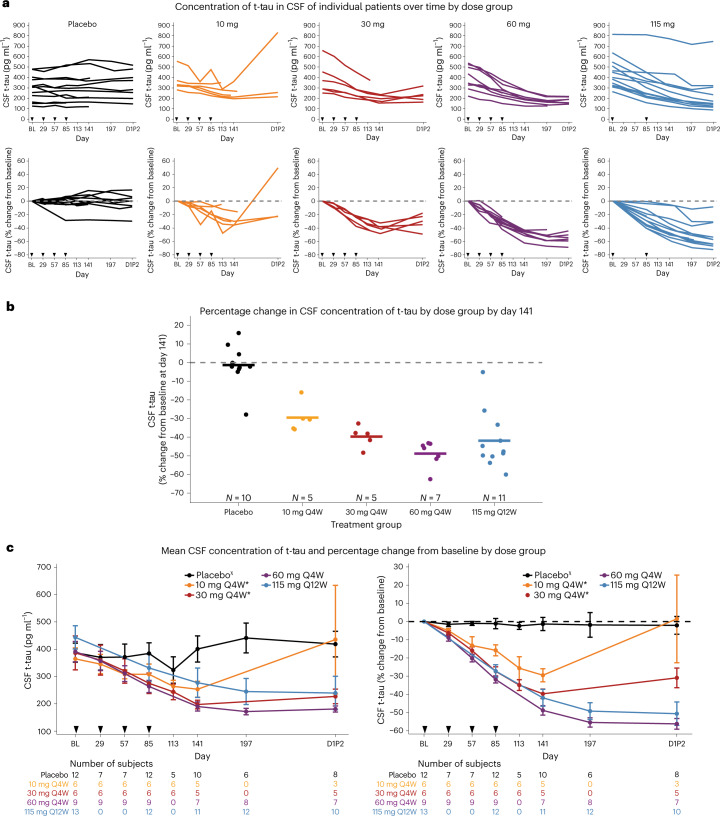
Fig. 3. Effect of MAPTRx on CSF concentrations of t-tau protein.
a, The concentrations of t-tau in CSF over time for individual patients in each dose group; absolute values, measured in picograms per milliliter (pg ml−1), are shown in the top graphs, and the percentage changes from baseline are shown in the bottom graphs. Arrowheads indicate the days on which MAPTRx or placebo was administered. b, The percentage change in the concentration of t-tau in CSF from baseline to the timepoint 56 days after the last dose (day 141). Circles indicate individual patients, and horizontal lines indicate group means. c, The mean concentration of t-tau in CSF (left) and the mean percentage change from baseline (right) over time according to dose group. CSF was not collected at 16 weeks post-last dose (day 197) for the 10 mg and 30 mg groups. Error bars indicate the standard error of the mean. Q4W and Q12W indicates dosing every 4 or 12 weeks, respectively. *Participants assigned to cohort A or B did not seamlessly transition to LTE part 2 and experienced a variable gap ranging from 5 to 19 months between completion of MAD part 1 at day 253 and start of LTE part 2 (D1P2). χPlacebo group was pooled. Subjects assigned to cohorts A or B and randomized to placebo had a variable gap between completion of MAD part 1 and start of LTE part 2 (D1P2).

