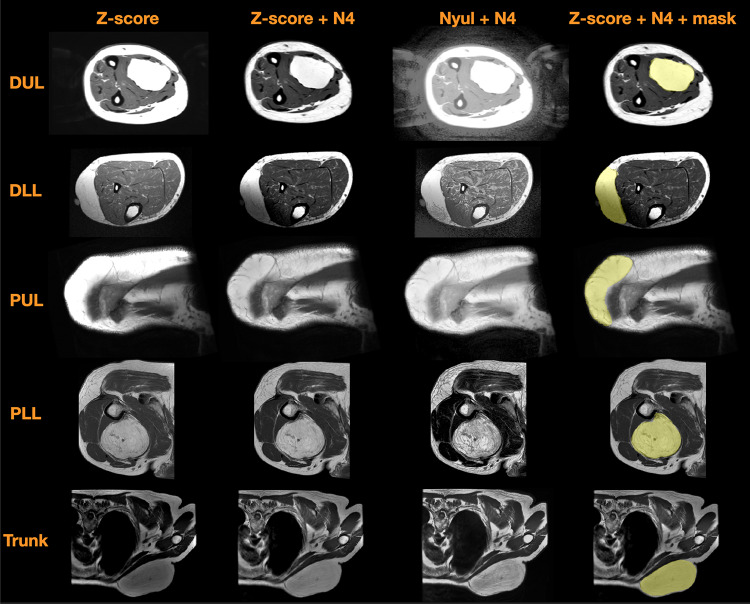
Fig. 3.
T1-weighted MR images per tumor location (left to right) normalized by Z-score before and after bias correction (N4), normalized by Nyul standardization after N4 correction and the manual delineations (yellow shade) overlaid on MR images. The images are displayed on the same scale. The images (top to bottom) are from distal upper limb (DUL), distal lower limb trunk (DLL), proximal upper limb (PUL), proximal lower limb (PLL), and trunk (T)

