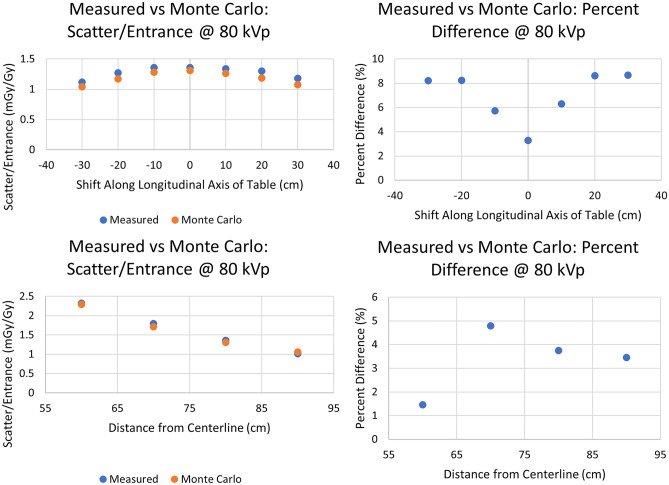
Fig. 17.
(Top) Comparison of Monte Carlo and empirical measurements after translating the detector location in a longitudinal direction parallel to the table by 10 cm intervals from the isocenter along a line 80 cm from the phantom centerline as in Fig. 7B. (Bottom) Comparison of Monte Carlo and empirical measurements after translating the detector location by 10 cm intervals along a line transverse to the catheterization table (0 cm shift along the longitudinal axis from isocenter) as in Fig. 7C. For both cases, the graphs on the left give the actual dose values while the graphs on the right give the absolute percent difference between measured and MC calculated dose values

