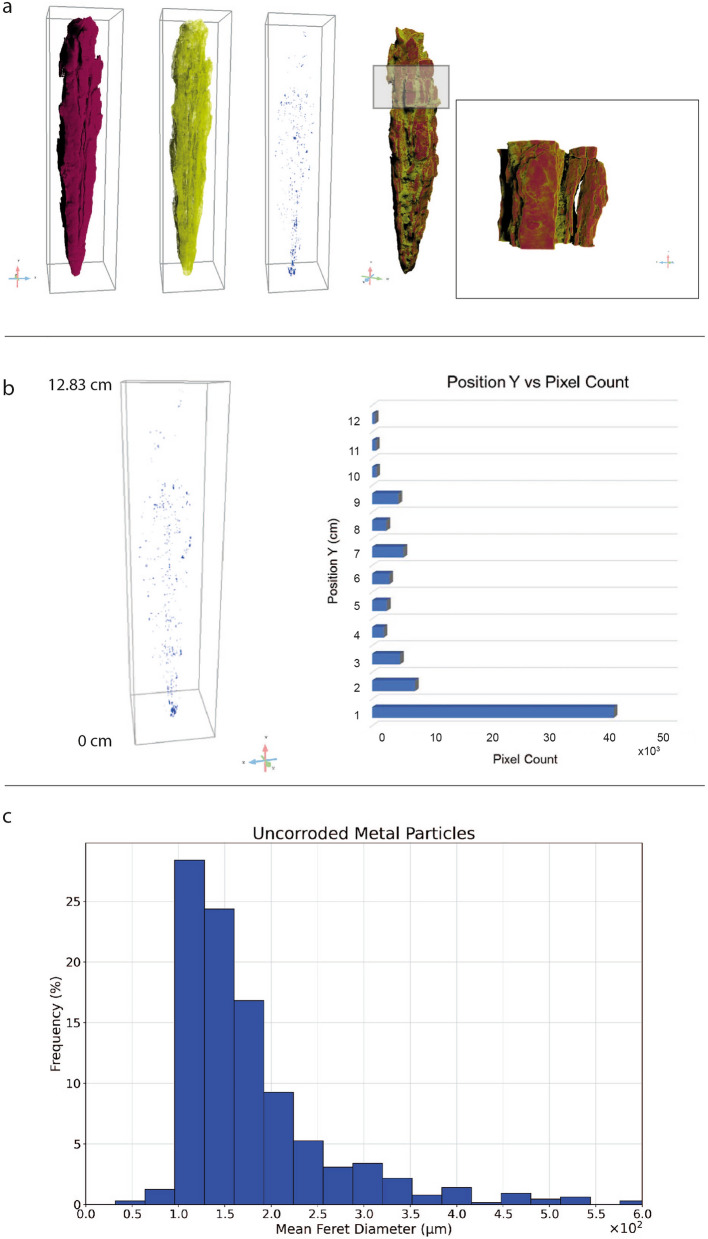
Figure 4.
3D reconstruction of the javelin and quantification of uncorroded metal particles (a) 3D reconstruction of the javelin and segmentation of the different phases composing the sample: the corrosion layers (bordeaux), soil (yellow) and uncorroded metal particles (blue) on the left side. An enlarged view of the upper part of the javelin is highlighted by the box revealing the presence of a great quantity of exfoliations accompanied with discontinuous aggregates appearing on the surface. This figure has been created with Dragonfly Pro Version 2022.1 Built 1259 (https://theobjects.com/index.html) (b) The uncorroded metal particles are mainly concentrated in the first centimeter of the javelin (0 ÷ 1 cm), close to the tip, where a total number of 40,452 voxels representing this phase was registered. In the range 2 ÷ 12 cm the average number of pixels representing the uncorroded metal particles is 2956. The graph has been generated with Microsoft Excel (https://www.microsoft.com/it-it/microsoft-365/excel) (c) The mean Feret diameter histogram of the uncorroded metal particles reveals that more than 91% of uncorroded metal particles were smaller than 0.3 mm, while the largest one was approximately 0, 6 mm in diameter. The graph has been created with Google Colab (https://colab.research.google.com/?hl=it).

