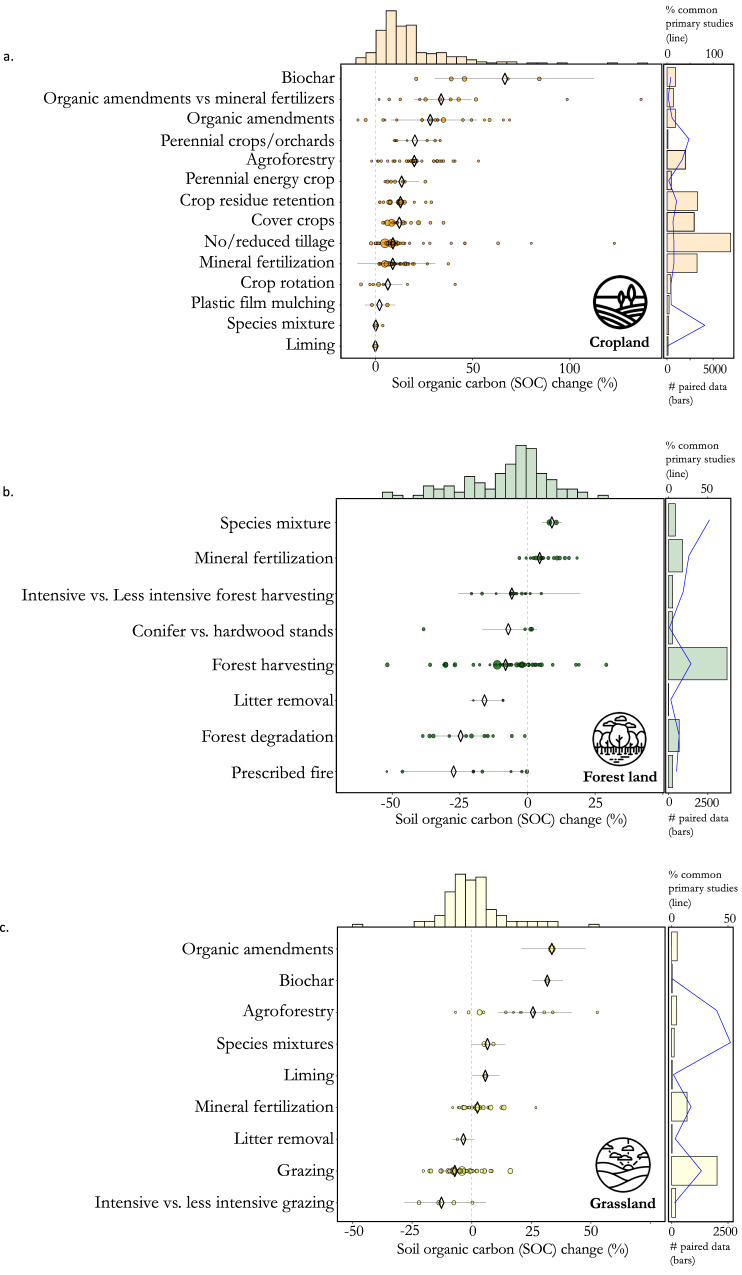
Fig. 3. Percentage change in soil organic carbon (SOC) due to land management practices.
Results are detailed for for croplands (a) forest lands (b) and grasslands (c) Diamonds and lines of the main plots represent the mean effect sizes and 95% confidence intervals (CIs), respectively. The dot sizes are proportional to the number of paired data analyzed. The histograms above each plot represent the probability distribution of effects for all practices combined. The bar plots on the right side of each main plot represent the number of primary studies for each practice (bars) and the percentage of primary studies used by at least two meta-analyses (lines). Forest degradation includes the transformation of primary forest to secondary forest and secondary forest to plantation forest. Details of the information used to make this graph as well as details by sub-category of land management are available at https://rpubs.com/dbeillouin/Figure3.

