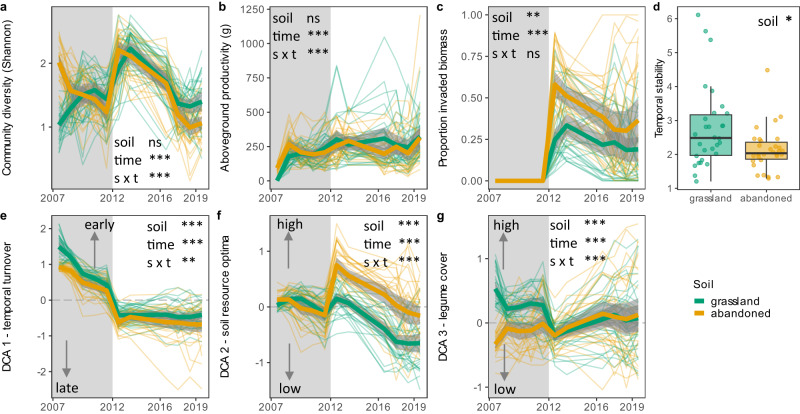
Fig. 1. Plant community development and temporal stability.
Plant community (a) diversity, (b) aboveground productivity, (c) biomass proportion of invaded plant species, (d) temporal stability based on aboveground productivity, and community compositional DCA scores related to plant species (e) temporal turnover, (f) ecological soil resource optimum and (g) legume cover of communities grown on natural grassland (green) and abandoned arable soil (yellow). In (e–g) arrows with text indicate the interpretation of the DCA scores. Grey shading indicates the time period in which communities established and no natural species invasion took place. From 2012 onwards, natural invasion of species from outside the sown species pool occurred. Thick lines indicate averages with the shading showing the 95% confidence intervals. Thin lines show each replicate (n = 30). Temporal stability was calculated as the inverse coefficient of variation of aboveground productivity over time. Boxplots indicate median (middle line), 25th, 75th percentile (box) and 5th and 95th percentile (whiskers) with single points indicating each replicate. Results of linear mixed effect models including sowing density as a random effect and type III Wald chi-square tests are presented. Significance codes: ***p < 0.001; **p < 0.01; ns = not significant, p > 0.05. For figures on species distribution on the DCA axes, see Supplementary Fig. 1. For exact statistical values, see Supplementary Data 1. Source data are provided as a Source Data file.

