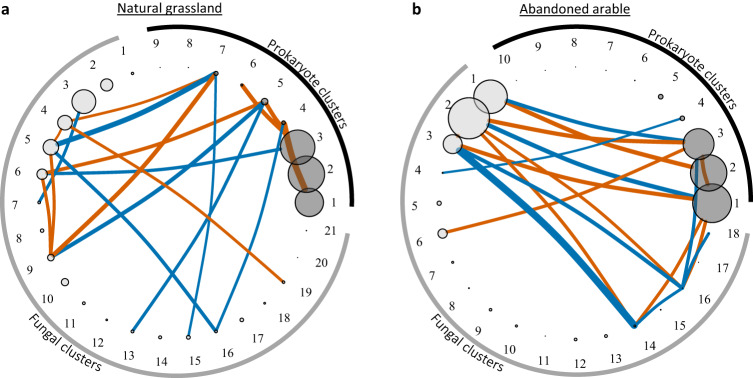
Fig. 3. Correlations between prokaryote and fungal network clusters.
Prokaryote (dark grey) and fungal network clusters (light grey) in (a) natural grassland and (b) abandoned arable soil. Only significant correlations after Bonferroni correction for multiple testing are presented (p < 0.0017 and p < 0.0018 for natural grassland and abandoned arable correlations, respectively). Negative correlations are indicated in vermillion, positive in blue. Width of the lines indicate the strength of the correlation and size of the vertices indicate the average size of the microbial network cluster based on relative reads within the prokaryote and fungal community each. Note that this means that cluster sizes can be compared between the two soils within the prokaryotes and fungal groups, but that prokaryote and fungal clusters are not scaled to each other and are therefore not directly comparable (but see Supplementary Fig. 2 for bacterial and fungal biomass comparison). For taxonomic and putative soil functions of each microbial network cluster see Supplementary Figs. 5–6 and Supplementary Tables 2–5. For exact statistical values, see Supplementary Data 1. Source data are provided as a Source Data file.

