Fig. 7.
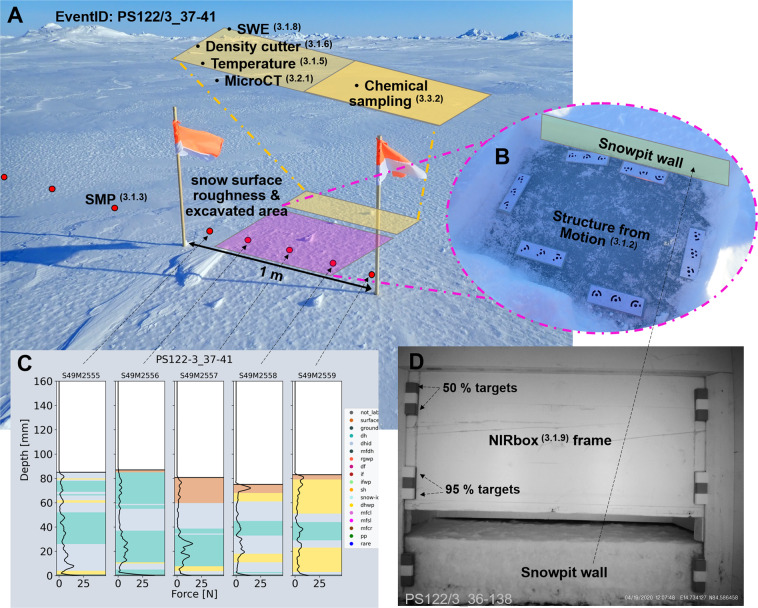
A case study of the measurements taken during event ID PS122/3_37-41. The overview image in the background of (A) gives an example of the conditions upon arrival at the snowpit. Annotations to this image show the different measurement locations and their relation to each other. The pink highlighted box shows the surface roughness measurement (SfM) location and the snowpit excavation area to allow access to the snowpit wall. Once excavated, the yellow box shows where the core measurements are taken, listed as bullet points. (B) shows the excavated pit revealing the underlying sea ice surface, also measured for roughness using SfM. The red points indicate the SMP measurements. The five central SMP measurements are located in the snowpit, and to capture spatial heterogeneity, sometimes additional measurements were conducted to the left and right of the snowpit. (C) shows the SMP force signals over depth with the categorised grain types26. This gives an indication of the spatial heterogeneity within the snowpit. The image in (D) is from the NIRbox during device operation ID PS122/3_36-138. The annotations of this figure show the reference targets (95 and 50%) and the NIRbox frame above the excavated snowpit wall.

