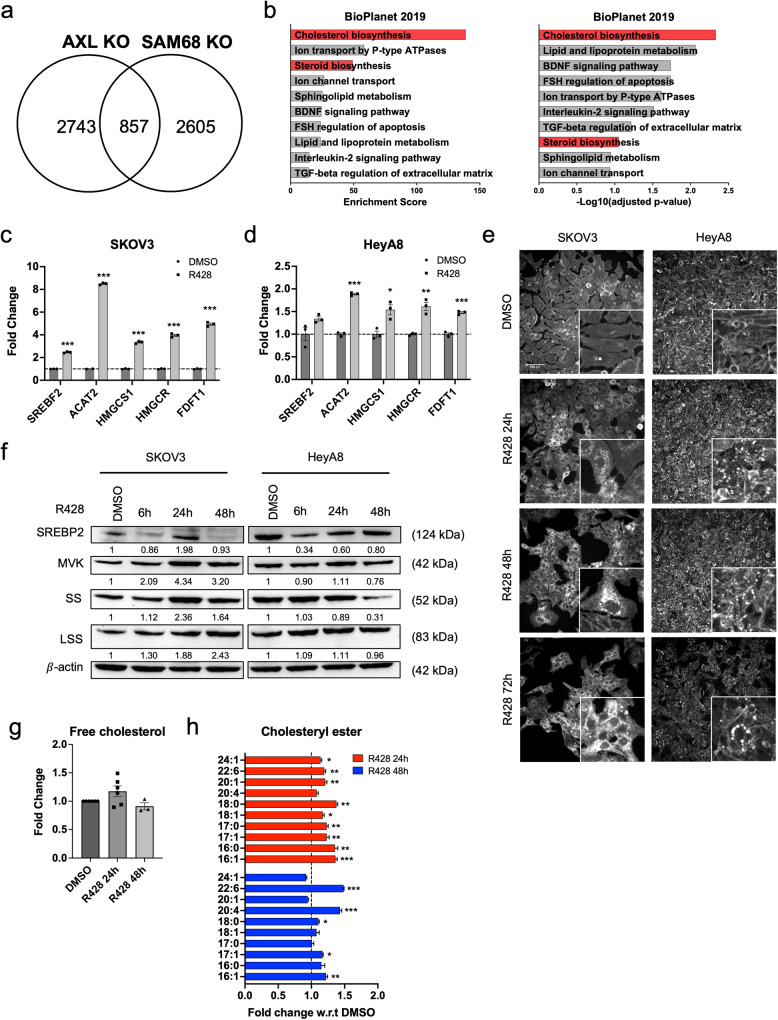
Fig. 7. AXL KO, SAM68 KO and AXL inhibition increase cholesterol biosynthesis.
a Venn diagram depicting the number of genes upregulated in HeyA8 AXL KO and SAM68 KO cell lines and their common genes upregulated. b Top 10 upregulated pathways of common differentially expressed genes in AXL KO and SAM68 KO cell lines. Red indicates candidate pathways chosen for validation. c Relative fold change in expression of cholesterol biosynthesis genes in SKOV3 and d HeyA8; *p < 0.05, **p < 0.01, ***p < 0.001, determined by two-tailed t-test with Welch’s correction. e Filipin III staining in SKOV3 and HeyA8. f Immunoblot of cholesterol biosynthesis protein expression levels peaking at 24 h upon AXL inhibition in SKOV3 and HeyA8. The numbers below blots reflect protein band intensity normalised against DMSO. g Quantification of free cholesterol levels and h cholesteryl esters levels upon treatment with AXL inhibition using LC–MS; *p < 0.05, **p < 0.01, ***p < 0.001, determined by two-tailed t-test with Welch’s correction.

