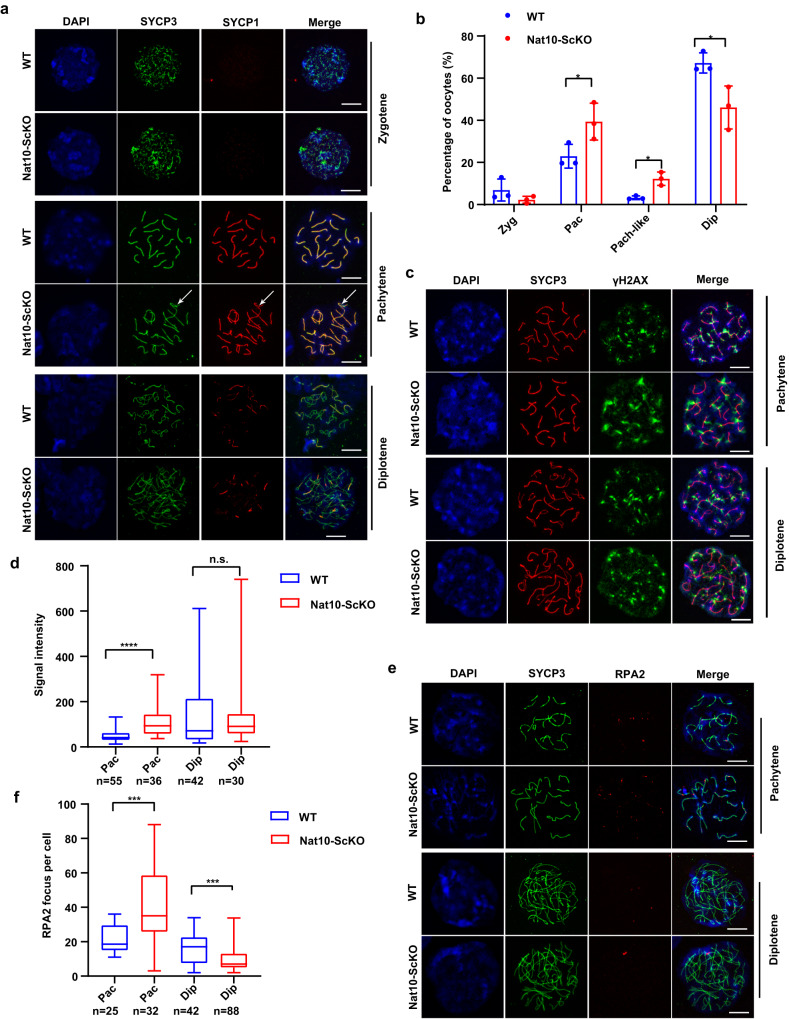
Fig. 3. Embryonic Nat10 loss caused oocyte meiotic prophase I arrest at pachytene stage owing to deficient DSB repair.
a Immunofluorescence staining of oocyte nuclear chromosome spreads by SYCP3 and SYCP1 markers in WT and Nat10-ScKO mouse ovaries at birth. Scale bar, 10 μm. Arrows point to the asynapsed structure of the lateral and central axes. b The statistical counts showing the percentage of oocytes at various stages as indicated. Data are presented as the mean ± SEM, n = 3, *p < 0.05 by two-tailed Student’s t-test. Pac, p = 0.0209; Pach-like, p = 0.0387; Dip, p = 0.0315. c IF staining by SYCP3 and γH2AX on surface-spread oocytes at pachytene and diplotene stages from WT and Nat10-ScKO mouse oocytes at birth. Scale bar, 10 μm. d The statistic counts showing the relative γH2AX signal intensity calculated by ImageJ in pachytene and diplotene oocytes. The box indicates the upper and lower quantiles, the thick line in the box indicates the median and whiskers indicate 2.5th and 97.5th percentiles. Data are presented as mean ± SEM, n = 3; ****p < 0.0001; n.s., not significant by two-tailed Student’s t-test. Dip, p = 0.9182. e IF staining on surface-spread oocytes by SYCP3 and RPA2 in WT and Nat10-ScKO mouse oocytes at birth. Scale bar, 10 μm. f Quantification of the numbers of RPA2 foci (representative of the unrepaired DSBs) in WT and Nat10-ScKO mouse oocytes at birth. Zyg zygotene, Pac pachytene, Pac-like pachytene-like, Dip diplotene. The box indicates the upper and lower quantiles, the thick line in the box indicates the median and whiskers indicate 2.5th and 97.5th percentiles. Data are presented as the mean ± SEM, n = 3; ***p < 0.001 by two-tailed Student’s t-test. Pac, p = 0.0001; Dip, p = 0.0002. n = 3 biologically independent samples were included in each group (a, c, e). Source data are provided as a source data file.

