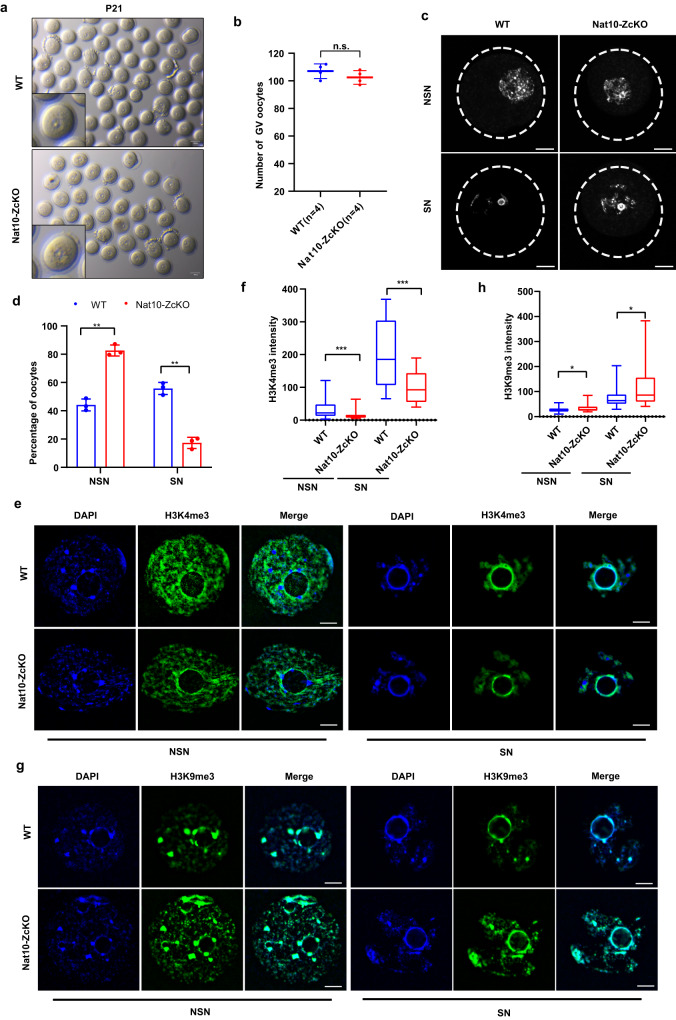
Fig. 5. Postnatal Nat10 deficiency impedes oocyte chromatin NSN–SN configuration transition.
a The gross morphology of oocytes at Germinal vesicle (GV) stage collected from PMSG-primed WT and Nat10-ZcKO females at P21. Scale bar, 100 μm. b Quantification of collected average numbers of GV oocytes. Data are presented as the mean ± SEM, n = 4. n.s., non-significant by two-tailed Student’s t-test. c Hoechst 33342 (Blue) staining of the GV oocytes with non-surrounded nucleolus (NSN) and surrounded nucleolus (SN) chromatin configurations in WT and Nat10-ZcKO oocytes. Scale bar, 20 μm. d The percentage of NSN-type and SN-type oocytes isolated from WT and Nat10-ZcKO mice at P21. Data are presented as the mean ± SEM, n = 3. **p < 0.01 by two-tailed Student’s t-test. NSN, p = 0.003; SN, p = 0.003. e, f Immunofluorescence staining by H3K4me3 in NSN-type (Left) and SN-type (Right) oocytes from PMSG-primed WT and Nat10-ZcKO mice in e, and quantification of H3K4me3 intensity in (f). Scale bar, 10 µm. The box indicates the upper and lower quantiles, the thick line in the box indicates the median and whiskers indicate 2.5th and 97.5th percentiles. Data are presented as the mean ± SEM, n = 3; ***p < 0.001 by two-tailed Student’s t-test. NSN, p = 0.0006; SN, p = 0.0003. g, h Immunofluorescence staining by H3K9me3 in NSN-type (Left) and SN-type (Right) oocytes from PMSG-primed WT and Nat10-ZcKO mice in (g), and quantification of H3K9me3 intensity in (h). Scale bar, 10 µm. The box indicates the upper and lower quantiles, the thick line in the box indicates the median and whiskers indicate 2.5th and 97.5th percentiles. Data are presented as the mean ± SEM, n = 3; *p < 0.05 by two-tailed Student’s t-test. NSN, p = 0.0318; SN, p = 0.0270. n = 3 biologically independent samples were included in each group (a, c, e, g). Source data are provided as a source data file.

