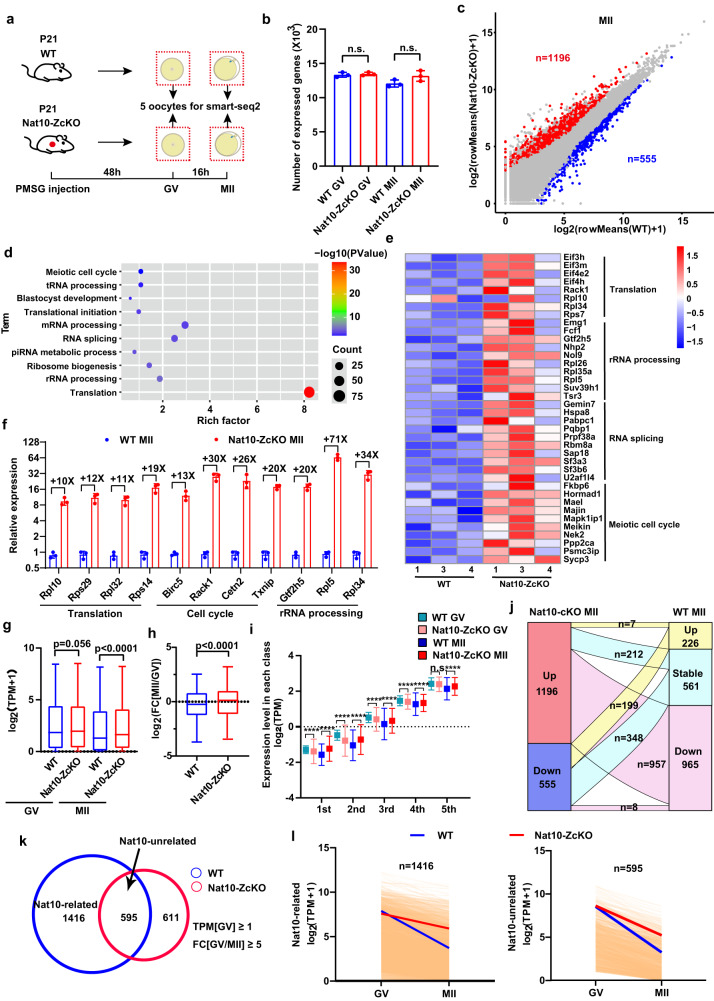
Fig. 7. Mini-bulk SMART-seq2 analyses identified the dysregulated maternal transcriptome in Nat10-ZcKO oocytes.
a A diagram showing mouse oocyte sample collection for mini-bulk SMART-seq2. b Bar graph showing the numbers of transcripts detected in WT and Nat10-ZcKO oocytes at GV and MII stages (TPM ≥ 1). The box indicates the upper and lower quantiles, the thick line in the box indicates the median, and the whiskers indicate the 2.5th and 97.5th percentiles. Data are presented as mean ± SEM, n = 3 biologically independent samples. n.s., non-significant by two-tailed Student’s t-test. c Scatter plot of mini-bulk SMART-seq2 data showing differentially expressed genes (DEGs) in Nat10-ZcKO MII oocytes. Red color: Up-regulated; Blue color: Down-regulated; Cutoff: fold change (FC) ≥ 2, adjusted p < 0.05. d Gene Ontology (GO) enrichment analysis of up-regulated genes in Nat10-ZcKO MII oocytes (Cutoff: FC ≥ 2, adjusted p < 0.05). e Heatmap of representative genes from four major functional GO categories showing up-regulated expression in Nat10-ScKO MII oocytes. f Bar plots showing the qPCR analyses of relative mRNA expression levels for a panel of up-regulated genes identified by mini-bulk SMART-seq2. Data are presented as the mean ± SEM, n = 3 biologically independent samples, and analyzed by two-tailed Student’s t-test. g and h Box plots showing the relative expression levels of the transcripts at the GV and MII stages as indicated in (g). The box indicates the upper and lower quantiles, the thick line in the box indicates the median, and the whiskers indicate the 2.5th and 97.5th percentiles. Data are presented as the mean ± SEM, n = 3. ****p < 0.0001 by two-tailed Student’s t-test.; and the relative fold changes of mRNA levels in (h). The box indicates the upper and lower quantiles, the thick line in the box indicates the median and the whiskers indicate 2.5th and 97.5th percentiles. Data are presented as the mean ± SEM, n = 3. ****p < 0.0001 by two-tailed Student’s t-test. i Box plot showing gene expression levels at the GV and MII stages with genes divided into 5 bins according to their relative expression abundance in the WT MII oocytes. Data are presented as the mean ± SEM, n = 3 biologically independent samples. ****p < 0.0001, n.s., non-significant by two-tailed Student’s t-test. j Sankey diagram showing the overlapping of the DEGs (1196 up-regulated vs. 555 down-regulated) with genes exhibiting up- [FC(MII/GV) ≥ 2, p < 0.05], down- [FC(MII/GV) ≤ −2, p < 0.05], or stable expression patterns in WT MII relative to GV stage oocytes (TPM ≥ 1). k Venn diagram showing the overlapping of down-regulated transcripts between WT MII oocytes relative to GV oocytes (2011, Cutoff: TPM ≥ 1, FC[GV/MII] ≥ 5), and Nat10-ZcKO MII oocytes relative to GV oocytes (1206, Cutoff: TPM ≥ 1, FC[GV/MII] ≥ 5). The total 595 overlapping transcripts represent those that were concurrently down-regulated in both WT MII and Nat10-ZcKO MII oocytes. In other words, they were degraded regardless of Nat10 presence (Nat10-unrelated). l Degradation trend patterns of maternal transcripts during the GV-MII transition in WT and Nat10-ZcKO oocytes. Each light-yellow line represents the expression levels of one gene, and the blue and red lines represent the median expression levels in WT and Nat10-ZcKO, respectively. Source data are provided as a source data file.

