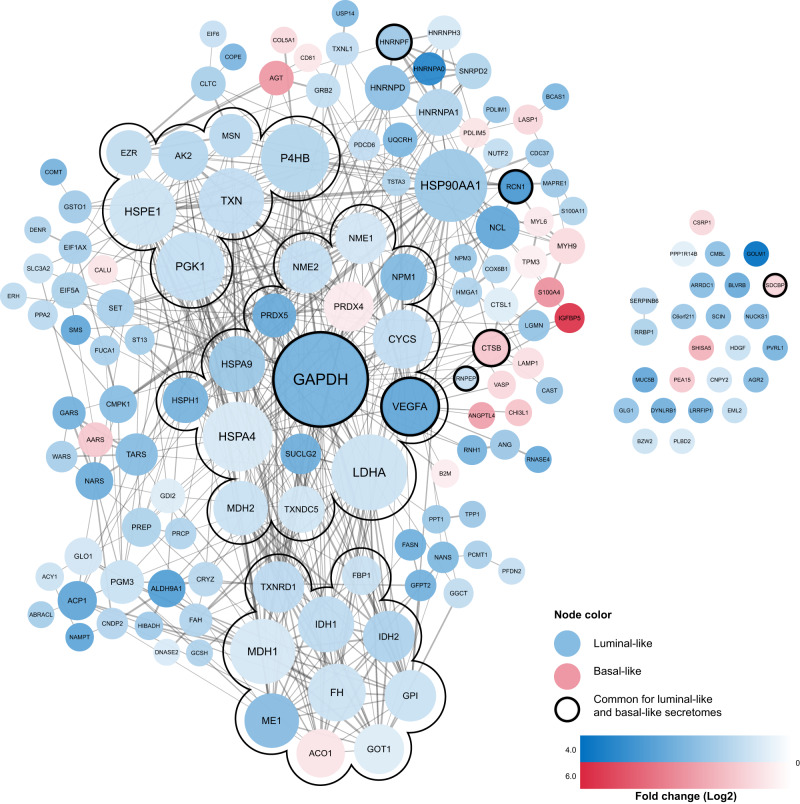
Fig. 3. Interaction network of hypoxia response proteins.
Protein-protein association network of the 150 hypoxia-upregulated proteins (PPI enrichment p-value < 1.0 × 10⁻¹⁶). Blue nodes represent luminal-like hypoxia response proteins, and red nodes represent basal-like hypoxia response proteins. The color intensity of the nodes represents fold change (Log2) compared to normoxic conditions, within each subtype (luminal-like cell lines, n = 2; basal-like cell lines, n = 2). The nodes with black borders represent proteins with increased secretion in response to hypoxia in both subtypes, in which the color represents the subtype with largest fold change. Node size represents the number of connections (degree), with larger node sizes representing a higher number of connections. The network contains three subclusters of highly interconnected proteins (MCODE 1.4.2) with overrepresentation of TCA cycle, glycolysis, and cell redox homeostasis, consisting of 10, 15 and 7 proteins, with 36, 52 and 12 connections, respectively, connecting the nodes within each subcluster.

