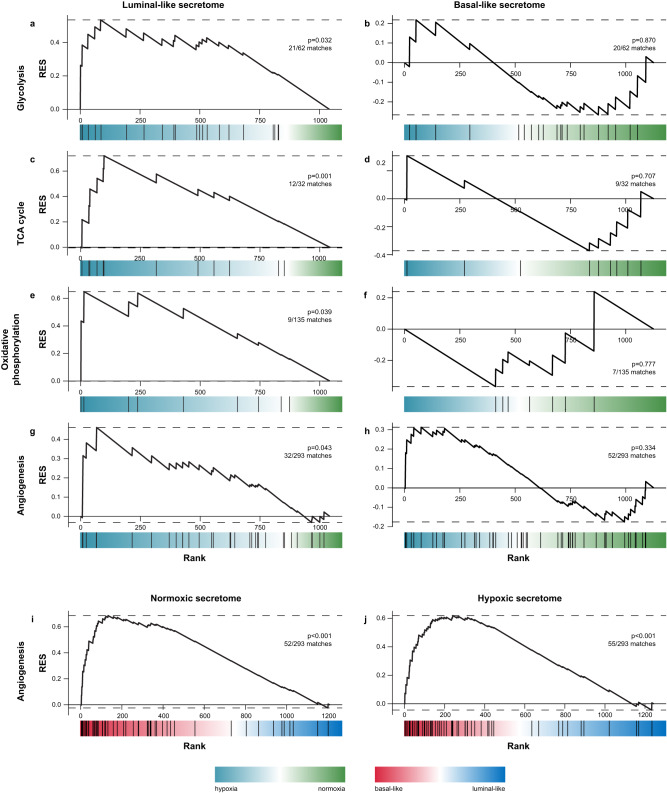
Fig. 4. Comparing hypoxic and normoxic secretomes in luminal-like and basal-like breast cancer cell lines.
Gene set enrichment analysis of secretome data ranked using a two-sided t-test from hypoxia-increased (blue) to hypoxia-decreased (green) in luminal-like (a, c, e, g) and basal-like (b, d, f, h) cell lines. The selected analyses show significant enrichment of KEGG pathways glycolysis, TCA cycle, oxidative phosphorylation and angiogenesis (GOID 1525) in the luminal-like hypoxic secretome. The basal-like hypoxic secretome was not enriched in either of the gene sets. Ranking the secretome data from basal-like (red) to luminal-like (blue) under normoxic (i) and hypoxic (j) conditions, showed an enrichment in angiogenic proteins in the basal-like subtype in both oxygen conditions. P-values were not adjusted for multiple testing. GSEA gene set enrichment analysis. RES running enrichment score. KEGG Kyoto Encyclopedia of Genes and Genomes. GO gene ontology analysis.

