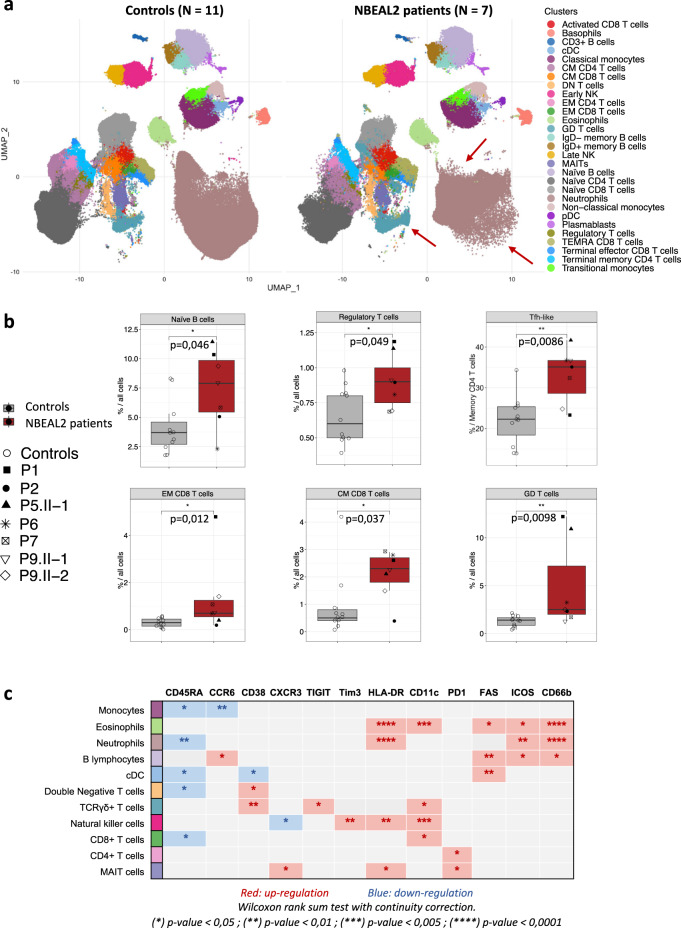
Fig. 2. Immunophenotyping of patients with GPS.
a Uniform manifold approximation and projection (UMAP) of immune cell subsets analyzed by CyTOF on whole blood samples from age-matched healthy controls (N = 11) and NBEAL2 patients (N = 7). Each cluster is color coded. The red arrows indicate changes in the cluster’s shapes of the patients group. The markers used to identify these cell clusters are shown in the heatmap of supplementary figure 2 A. cDC classical dendritic cell, CM central memory, EM effector memory, pDC plasmacytoid dendritic cell, TEMRA terminally differentiated effector memory re-expressing CD45RA, NK natural killer, MAIT mucosal associated invariant T cell. b Statistically significant cluster biases observed in the CyTOF immune phenotype from healthy controls and NBEAL2 patients. Results shown correspond to 11 controls and 7 NBEAL2 patients. The line at inside the box is the median value (50th percentile). Minima and maxima of the boxes correspond to 25th and 75th percentile. Whiskers marks the 10th and 90th percentile. Two-tailed p-values were determined with a Wilcoxon rank-sum test with continuity correction. *p-value < 0.05; **p-value < 0.01; ***p-value < 0.005; ****p-value < 0.0001. TFH-like T follicular helper cells, EM effector memory, CM central memory, GD T cells: γδ T cells. Source data are provided as a Source Data file. c Table summarizing the significant overexpression (red) or downregulation (blue) of biological markers in the different immune cell subsets from GPS patients versus healthy controls. Two-tailed p-values were determined with a Wilcoxon rank sum test with continuity correction. *p-value < 0.05; **p-value < 0.01; ***p-value < 0.005; ****p-value < 0.0001.

