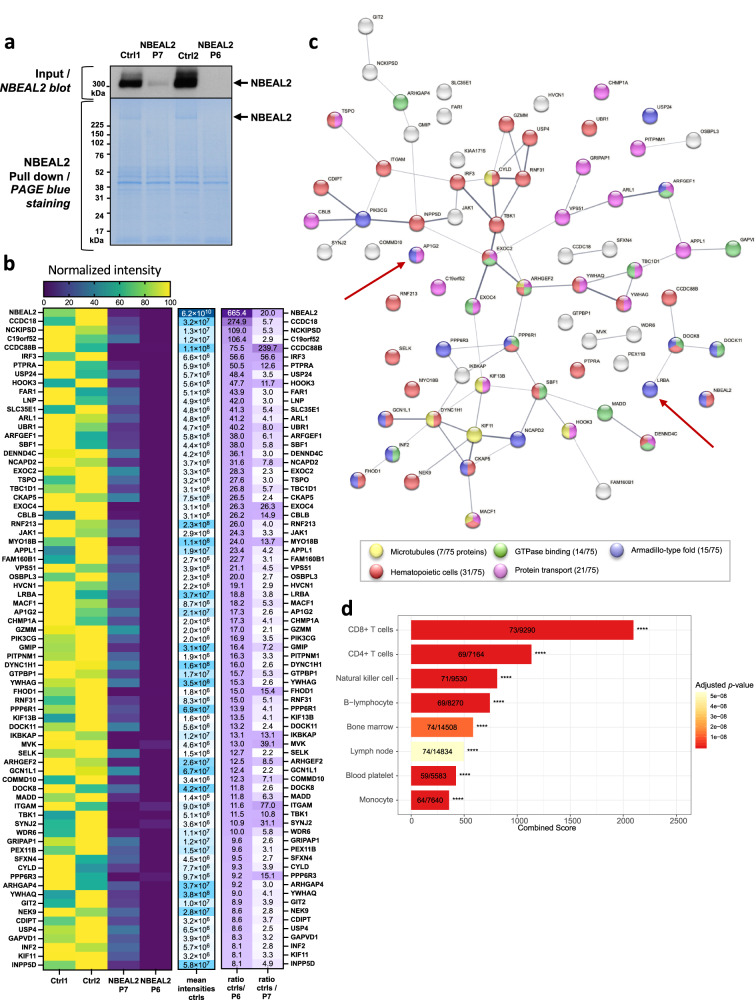
Fig. 3. NBEAL2’s partners in activated T cells.
a Immunoblotting of NBEAL2 in T cells lysate from healthy subject (Ctrl 1 and 2) and NBEAL2 patients (P6, P7). Immunoblot of the input fractions before NBEAL2 immunoprecipitation in T cells (top) and Page Blue staining after NBEAL2 pull down (bottom). Experiment performed once. b Heatmaps of the selected NBEAL2 partners after mass spectrometry analyses. The left heatmap shows normalized intensities of the 74 proteins selected after mass spectrometry analysis of the NBEAL2 interactome. The middle heatmap represents the mean intensities detected for the two controls (by mass spectrometry). The heatmap on the right shows the intensities ratio of the mean control intensity over each NBEAL2 patient. The proteins are ranked by intensities ratio of controls over NBEAL2 patient P6. c STRING network analysis of the 74 proteins and node coloring per function. The network edges indicate both functional and physical protein associations: proteins jointly contribute to a shared function. However, the network edges do not necessarily mean proteins are physically binding to each other. The line thickness indicates the strength of data support. d Analysis of the 74 proteins partners of NBEAL2 in enrichR using the Jensen Tissue library. The most represented cells in which the proteins partners are expressed is shown. In the barplots the number of proteins versus the number of proteins defining the cell type is indicated. Two-sided p-value is obtained with a Fischer’s exact test and adjusted with a Benjamini–Hochberg correction. The combined score is a combination of the p-value and z-score calculated by multiplying the two scores. Source data are provided as a Source Data file.

