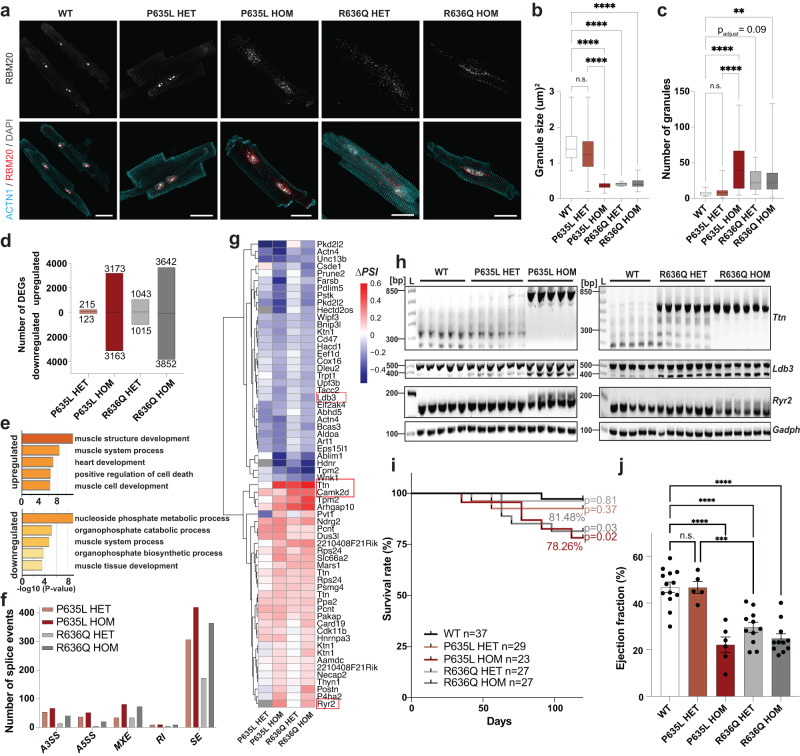
Fig. 1. Molecular and physiological characterization of P635L and R636Q mouse lines.
a Confocal images of isolated adult murine cardiomyocytes. Scale bar: 20 μm. ACTN1 was used as cardiomyocyte marker. b, c RBM20 granule size (b) and amount (c) in adult mouse cardiomyocytes. N = 21 (WT), 16 (P635L HET), 28 (P635L HOM), 16 (R636Q HET) and 39 (R636Q HOM) images with 1–4 cells each obtained from three mice per genotype. Boxplots depict the median with the box including the 25–75th percentile and the whiskers ranging from the smallest to the largest value. d Number of DEGs (Padjust < 0.05) in bulk RNA-seq of Rbm20 mutant mice compared to WT. N = 5 mice per genotype. e GO analysis (biological function) of DEGs overlapping for both P635L and R636Q HOM mice with a stringent cut-off of Padjust < 1e−10 to reduce the number of DEGs for display in Supplementary Fig. 2. f Number of differentially spliced events compared to WT detected and categorized by rMATS: alternative 5‘ or 3‘ splice site (A5SS or A3SS), mutually exclusive exons (MXE), retained intron (RI), skipped exon (SE). g Averaged ΔPSI ( = percent spliced-in) values relative to WT of significant differentially spliced events (Padjust < 0.01, ΔPSI > 0.1) overlapping in both HOM Rbm20 mutant mice. Multiple splice events per gene are depicted if they match the selection cut-off. Genes in red were validated by RT-PCR or qPCR. Grey squares indicate that the splice event was not detected by rMATS. h RT-PCR of RBM20 target genes Ttn, Ryr2, Ldb3 and the housekeeping gene Gapdh. i Kaplan–Meier survival curve of mutant mice monitored for 120 days. P value obtained by Log-rank test between each mutant and WT indicated next to the curves. Percentage of survival indicated for HOM mice. j Percentage of ejection fraction determined by narcosis echocardiography of mutant mice. N = 13 (WT), 5 (P635L HET), 6 (P635L HOM), 11 (R636Q HET) and 11 (R636Q HOM) mice. P values in (b, c, j) obtained from one-way ANOVA with Tukey’s multiple comparison test: ****P < 0.0001, ***P < 0.001, **P < 0.01, n.s. = not significant. All data were obtained in 16-week-old mice except in (j) where data of 24-week-old mice is shown. Error bars depict the standard error of the mean (SEM) in all panels.

