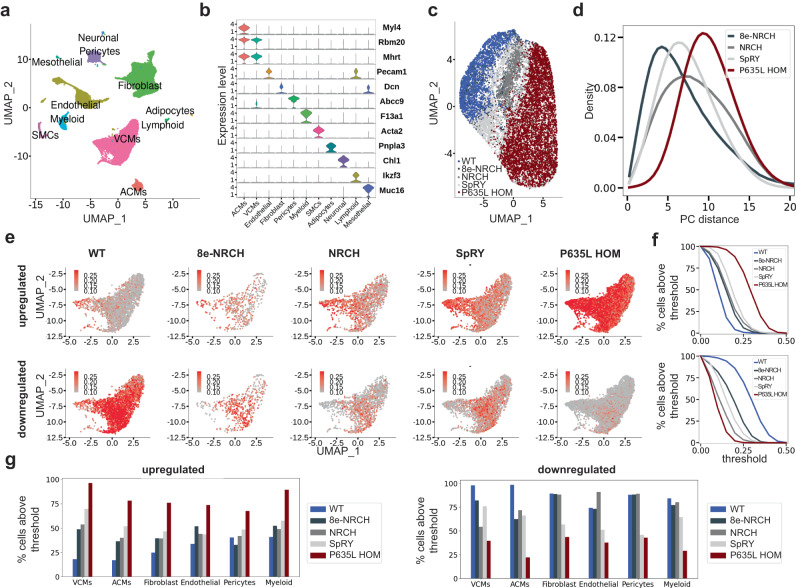
Fig. 4. Cell type-specific profiling of cells after base editing by snRNA-seq.
a UMAP projection integrating all datasets and annotated based on their gene expression profile. b Expression of known marker genes defining the main cell types. c UMAP projection of ventricular cardiomyocytes from WT, P635L HOM, and base-edited mice. d Histograms depicting the distribution of pairwise Euclidean distances of ventricular cardiomyocytes from P635L HOM and base-edited mice relative to WT using the two largest principal components (PC). e UMAP projection showing the activity score (see 'Methods' section snRNA-seq analysis) of cardiomyocytes using a subset of genes that were up- or downregulated in P635L HOM relative to WT. Maximum 15 significantly up- or downregulated were used. DEGs are listed in Supplementary Data 3. f Threshold of activity score values based on (e) relative to percentage of cells above the threshold for genes upregulated (upper panel) or downregulated (lower panel) in P635L HOM cardiomyocytes relative to WT. g Percentage of cells above the critical threshold for genes upregulated or downregulated in P635L HOM cells relative to WT. VCMs ventricular cardiomyocytes, ACMs atrial cardiomyocytes, SMCs smooth muscle cells. Data were generated by snRNA-seq of isolated nuclei from two mice per condition.

