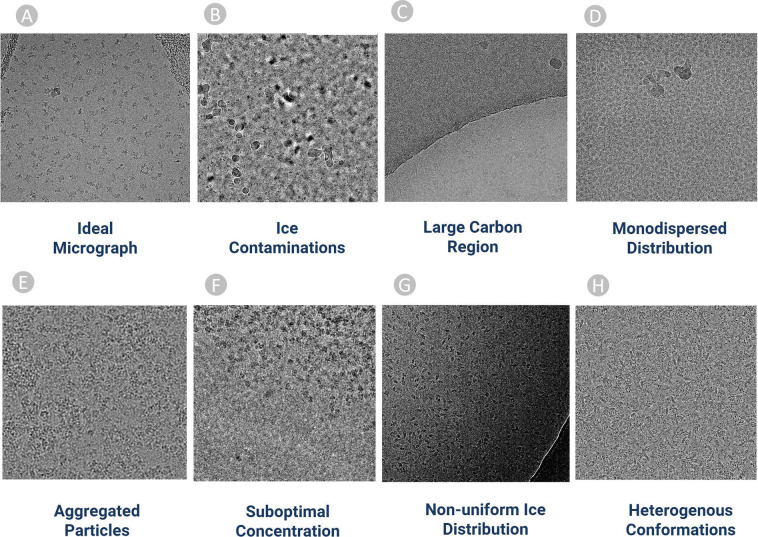
Fig. 2.
Examples of diverse cryo-EM micrographs in CryoPPP used for particle labelling. (A) Ideal micrographs (EMPIAR-10590) containing protein particles with sufficient contrast that can be easily identified by naked eye. (B) Micrographs containing an abundance of ice patches and contaminations (EMPIAR-10532). Crystalline ice is evident by the cluster of light and dark patches making it difficult to distinguish true protein particles from false positives. (C) Micrograph containing large carbon areas (EMPIAR-10005). (D) Micrographs containing a monodisperse distribution of protein particles (EMPIAR-10852). (E) Large Cluster of clumped protein particles making it difficult to recognize and pick particles (EMPIAR-10387). (F) Micrographs (EMPIAR-11057) containing protein particles overcrowded at upper half region. (G) Difference of ice thickness resulting in the top left part to appear brighter and the bottom right part darker. A crack within the vitrified hole in the lower right part of micrograph causing blurring effect (EMPIAR-10017). (H) Micrograph (EMPIAR-10093) containing heterogeneous top, side, and inclined views of protein particles.

