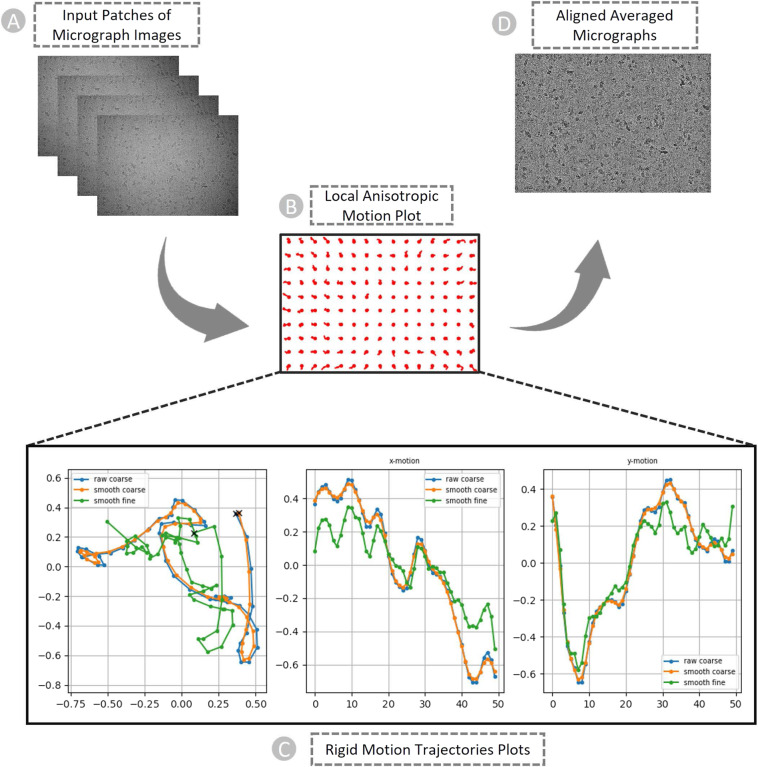
Fig. 5.
The patch-based local and global motion correction pipeline for EMPIAR ID 10737 (E. coli cytochrome bo3 in MSP Nanodiscs). (A) Full frames of micrographs as input. (B) Anisotropic deformation. (C) Rigid motion trajectories plots. Blue: original trajectory, Radish: trajectory with small smoothing penalty, Green: trajectory with fine smoothing. Left: Overall motion trajectory over X and Y motion. Center: X-motion plot over time. Right: Y-motion plot over time. (D) Non-dose weighted aligned averaged micrographs with the highest amount of signal and least amount of motion blur as output.

