Fig. 1.
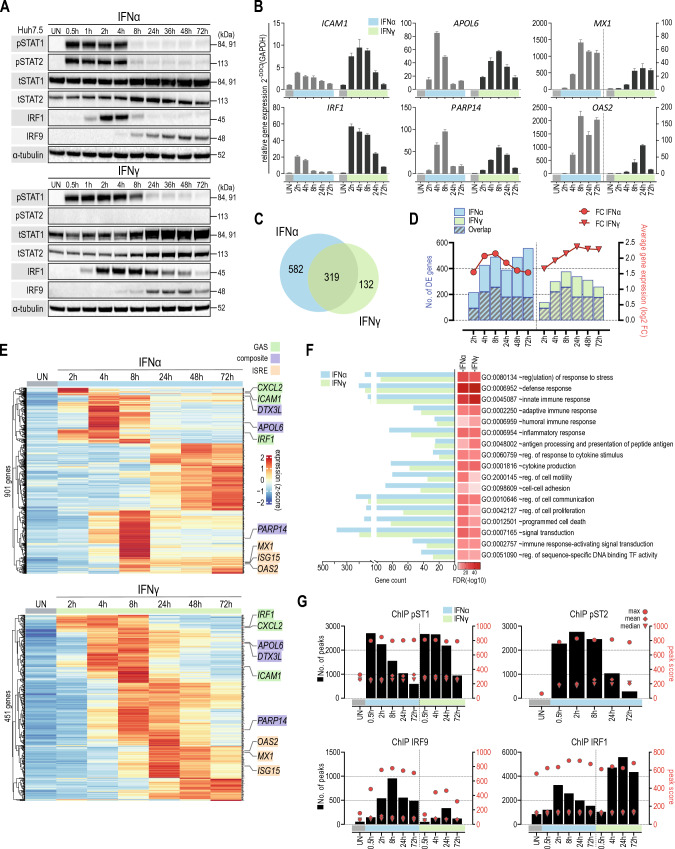
GAS, ISRE and composite genes are commonly involved in IFNα- and IFNγ-mediated transcriptional responses and chromatin interactions. A Huh7.5 cells were treated with IFNα (1000 U/ml) or IFNγ (10 ng/ml) for the indicated times. The expression levels of STAT1, STAT2, IRF9 and IRF1 were evaluated by immunoblotting; p phosphorylated, t total. B Expression profile of pre-selected ISGs quantified using qPCR. Cells were left untreated or stimulated with IFNα (1000 U/ml) or IFNγ (10 ng/ml) for the indicated time. Relative expression (over GAPDH) was estimated. n = 3; mean ± SEM. C Venn diagram based on RNA-seq results showing total numbers of uniquely and commonly up-regulated genes in Huh7.5 cells after IFNα or IFNγ stimulation (log2FC > 0.5; padj < 0.05). D Number of up-regulated genes (log2 FC > 0.5 and padj < 0.05) in each time-point is indicated using color bars (corresponding values—left y-axis). The area of the bar covered with lines represents the number of overlapping genes between analogous time-points for both IFNs. Average gene expression is shown using red lines with symbols (corresponding values—right y-axis). E Heatmaps generated from the expression values of all up-regulated genes in Huh7.5 cell treated with IFNα or IFNγ. Each row represents one gene. Counts were normalized using Z-score. Pre-selected genes are marked on each graph. The color of the gene name corresponds to the binding site recognized in the promoter of the gene. F Gene Ontology terms enrichment analysis of up-regulated genes by IFNα or IFNγ (significant enrichment considered with FDR < 0.05). G Characterization of ChIP-seq peak score and distribution for pSTAT1, pSTAT2, IRF9 and IRF1 in IFNα- and IFNγ-stimulated Huh7.5 cells. Black bars represent a number of peaks called using spp and thresholded using Irreproducible Discovery Rate (IDR) for each time-point separately (corresponding values—left y axis). Red circles, triangles and rhombi represent the maximum, median and mean peak values, respectively (corresponding values—right y axis)

