Figure 5.
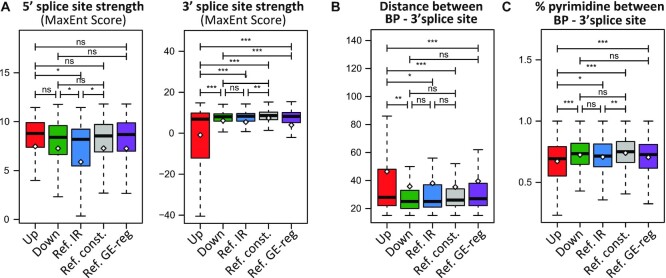
Proximal introns regulated by CDK12/13 activity are characterized by weak 3′ splice sites. (A) Box plots representing comparison of the 5′ and 3′ splice site strength (MaxEnt score) between proximal introns (first and second) up- and down-regulated by THZ1 treatment, reference IR events not affected by THZ1 treatment (Ref. IR), constitutively spliced introns (Ref. const.) and introns from genes regulated by THZ1 only at the GE level (Ref. GE-reg). (B and C) Boxplots showing comparison between the groups described in (A) for distance (B) and percentage of pyrimidine (C) between the branchpoint (BP) and the 3′ splice site. Statistical analyses were performed by Student's test *P <0.05; **P <0.01; ***P <0.001, ns = not significant.

