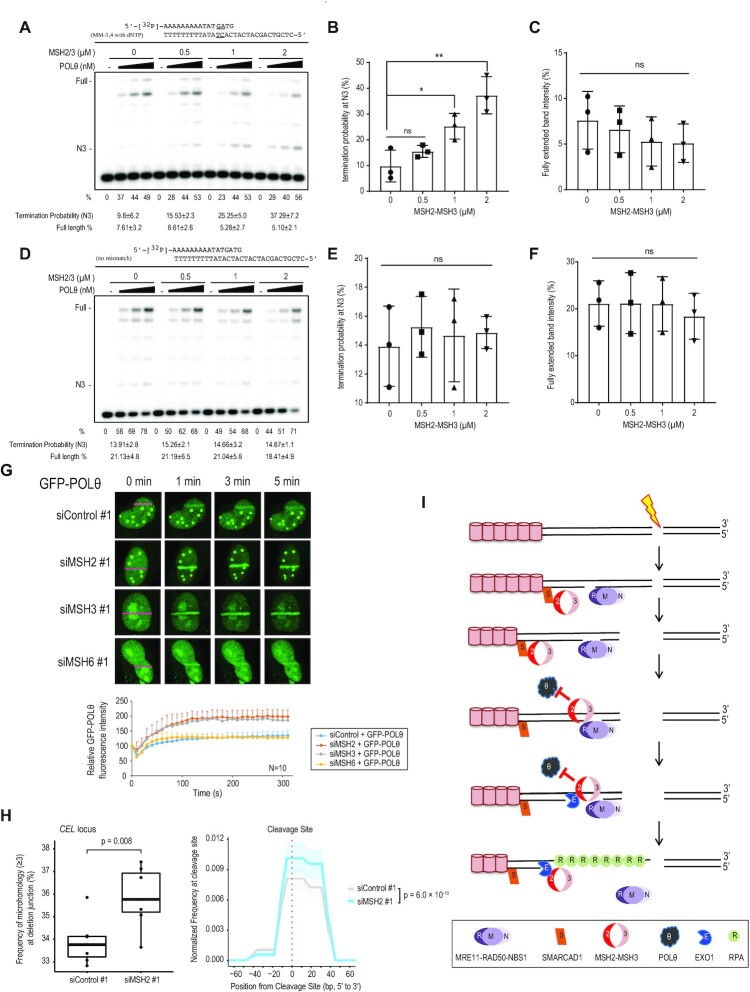
Figure 7.
MSH2-MSH3 inhibits POLθ extension from a mismatched primer. Increasing amounts of POLθ (0.3, 0.6, and 1.3 nM) were incubated in the presence of the indicated amounts of MSH2-MSH3 and 5′-32P-labeled primer templates, shown at the top of the gel, at 37°C for 10 min. The first lane (−) contained no enzyme. (A) Percentage (%) of the product extending from the primer is shown below each lane. Two mismatched base pairs were placed at the third and fourth bp from the primer-template junction. (B) The termination probability at position N3 is defined as the band density at N3 divided by the intensity of ≥N3. (C) The quantity of full-length extension products was calculated as the fully extended band density divided by the intensity ≥ N0 (primer position). MSH2-MSH3 on non-mismatched substrates did not disturb POLθ extension (D–F). Data are presented as mean ± standard deviation (n = 3). P-values were calculated using two-tailed Student's t-test. (G) U2OS cells were transfected with control, MSH2, MSH3, or MSH6 siRNAs. After 24 h, cells were transfected with GFP-POLθ. Data are presented as mean + standard deviation (n = 10). (H) Mutation signatures at the CEL locus upon CRISPR-Cas9-induced DSB were compared those in control and MSH2 knockdown HEK293T cells. Boxplot showing the frequency of deletion mutations harboring microhomology longer than two nucleotides at the DNA junction out of the total deletion mutations induced by CRISPR-Cas9 targeting the CEL locus in control and MSH2 knockdown HEK293T cells. P-values were calculated using an unpaired two-tailed t-test (n = 7) (left). DNA deletion spectrum associated with microhomology longer than four nucleotides induced by CRISPR-Cas9 targeting the CEL locus in control and MSH2 knockdown HEK293T cells. P-values were calculated using a paired two-tailed t-test (n = 7) (right panel). (I) A model of how MSH2-MSH3 acts in the early stages of HR. Processing of only one end of the DSB is shown in the figure.

