Figure 2.
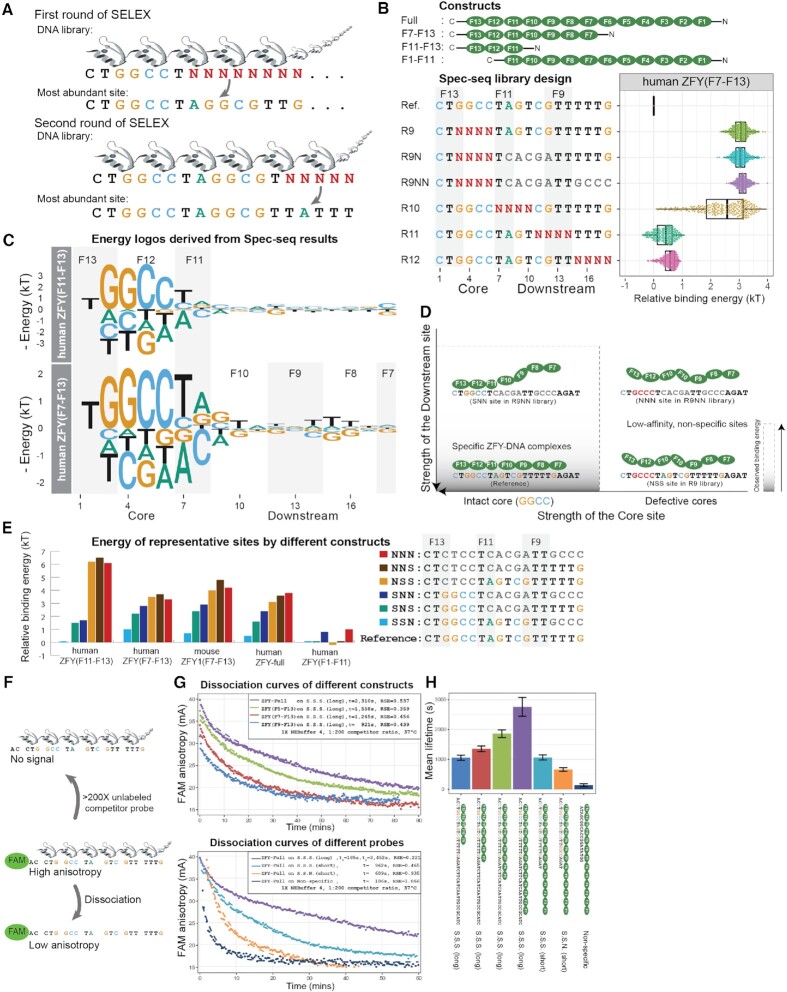
Quantitative analysis of ZFY reveals that its downstream recognition depends on the presence of perfect core. (A) Workflow of two rounds of HT-SELEX with previously identified binding site as the anchor position. (B) Tested constructs, Spec-seq library design and the variants distribution of observed binding energy under human ZFY (F7-F13) construct. (C) Position energy logo constructed by regression of all single variants of reference site. (D) Dependent recognition model for Zinc Finger Y (ZFY); Without intact core, there is no observed specificity towards downstream region. (E) Energy levels for representative binding sites under different constructs; S.S.N. is short name for Specific-Specific-Non-Specific, and so on. (F) Workflow of florescence anisotropy assay to measure the intrinsic dissociation rates of various protein-DNA complexes; >200X unlabeled competitor probe was added to the pre-equilibrated binding reaction right before the kinetics monitoring processes. (G) Upper panel shows dissociation curves for full-length ZFY over various DNA probes; Lower panel shows dissociation curves for full-length and various truncated ZFY constructs over S.S.S. (long) DNA probe; Single phase exponential curve was used to fit all observed data, except the ZFY-Full over S.S.S. (long) in lower panel, which shows two-phase exponential curve; Residual Standard Error (RSE) were listed on he upper right panels. (H) Summary of observed dissociation rates of different constructs over various probes; Each sample was measured for at least three times; Sample means and standard deviations were derived from fitted single exponential curves.

