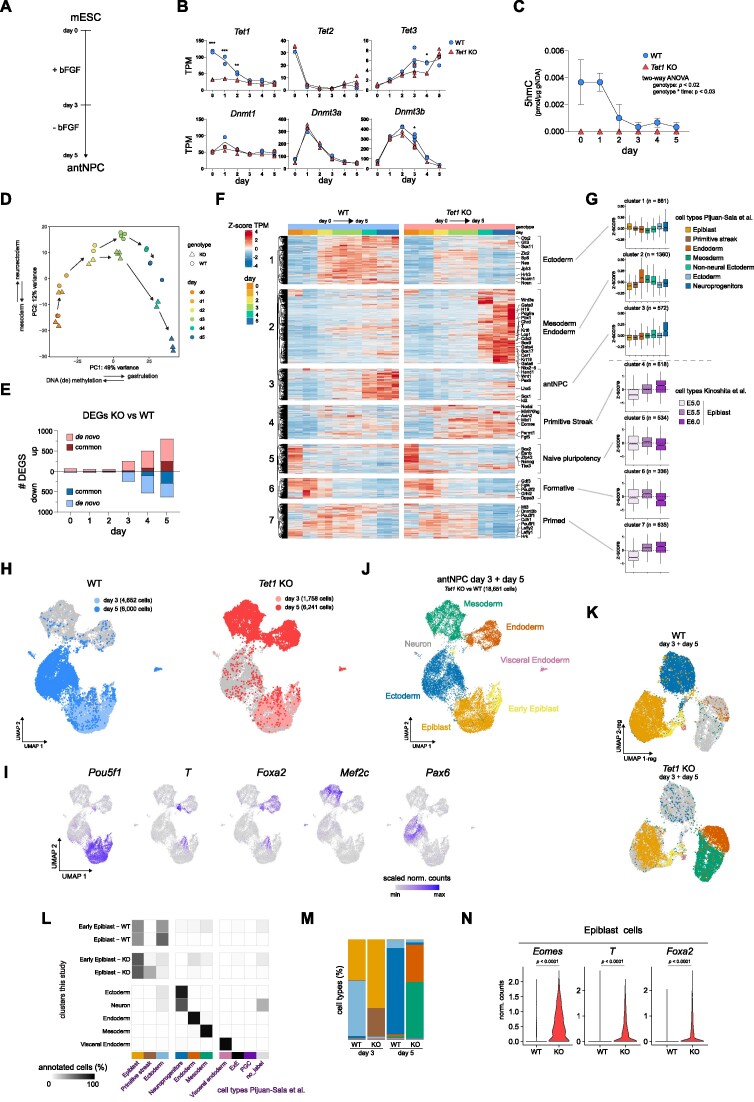
Figure 1.
Divergent lineage trajectories of Tet1+/+ and Tet1−/− cells over a differentiation time-course. (A) Schematic of basic fibroblast growth factor (bFGF)-driven neurobasal differentiation protocol to convert mouse ESCs into anterior neural progenitor cells (antNPCs) in 5 days. (B) Expression levels of TET DNA dioxygenases and DNA methyltransferases (DNMTs) during differentiation of wild type (WT) and Tet1 KO ESCs in transcripts per million (TPM) measured using bulk RNAseq. Data are shown as the mean of four samples at day 3, three samples at day 5 and otherwise 2 samples at all other time-points. ***P-value < 0.001; **P-value < 0.01; *P-value < 0.05. (C) Quantification of 5hmC based on dot blots. Data are shown as mean ± SEM of n = 3 independent ESC lines per genotype. (D) PCA plot of bulk RNA-seq data obtained during the differentiation time course. Representative terms and direction of GO processes that are enriched in top 100 genes contributing to each principal component are indicated next to the axes. (E) Number of up and down-regulated differential expressed genes (DEGs) in Tet1 KO versus WT per day, classified as de novo or in common with DEGs observed earlier. DEGs are defined based on a P adjusted value <0.05 and log2 |fold change| > 1. (F) Time course heatmap of a composite of DEGs based on genotype pairwise comparison and temporal analysis, clustered using k-means clustering and shown as the Z-score of TPM values. (G) Z-score based on log-normalized counts or TPM of cluster genes in Figure 1F as measured in different collated lineages from scRNA-seq reference dataset (2), or E5.0, E5.5 and E6.0 bulk RNA-seq datasets (7). (H) UMAP of integrated scRNA-seq data of both Tet1 KO and WT cells collected at day 3 and day 5 of differentiation. For clarity the UMAP is split by genotype. (I) Expression levels of lineage markers projected on UMAP space and expressed as scaled normalized counts. (J) Lineage identity of UMAP clusters. (K) UMAP based on regulon activity in day 3 and day 5 scRNA-seq samples, shown separately per genotype. Regulons are coloured to correspond to their lineage identity shown in (J). (L) The percentage of cells annotated to collated cell types from the mouse gastrulation scRNA-seq reference dataset (2) per defined cluster as defined in (J). Since the Early Epiblast and Epiblast clusters are composed of roughly equal proportion of both WT and Tet1 KO cells from day 3, they are split per genotype. (M) Proportion of annotated cell types per sample, using the colour scheme per cell type shown in (L). (N) Expression of primitive streak markers Nanog, T and Foxa2 in Tet1 KO and WT cells only in the Epiblast cluster, shown as normalized counts.

