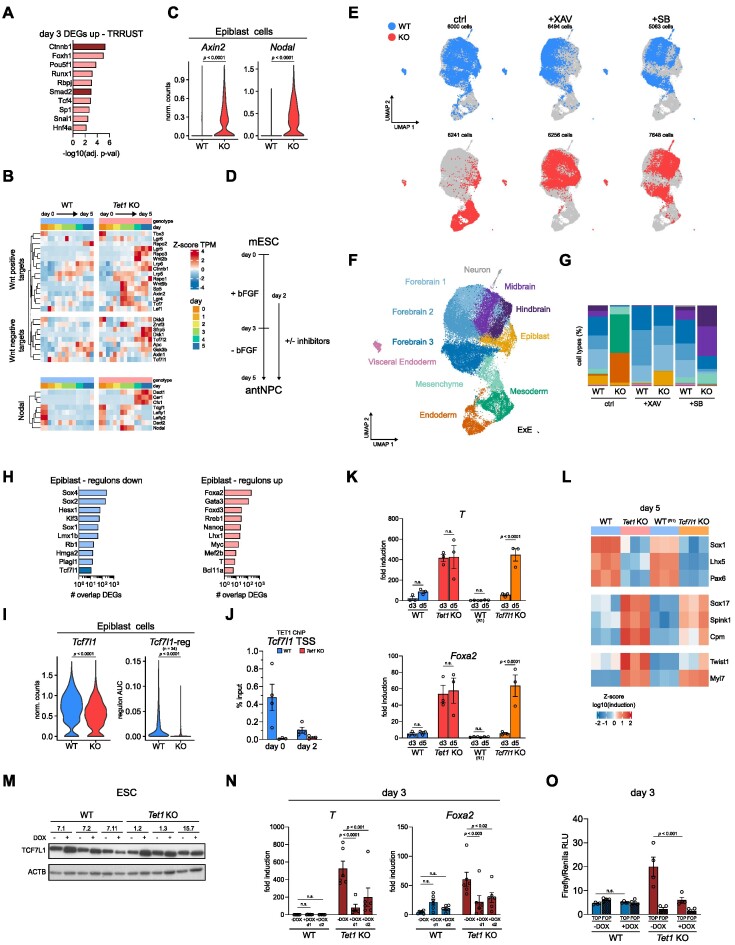
Figure 2.
Activation of Wnt/β-catenin signalling by de-repression of the Tcf7l1 gene-regulatory network in Tet1−/− cells. (A) Top 10 transcription factors (TFs) predicted to regulate up-regulated DEGs in Tet1 KO cells at day 3. (B) Time-course expression heatmap of genes involved in Wnt positive and negative regulation and Nodal signalling, shown as the Z-score of RNA-seq TPM values. (C) Expression of direct targets of Wnt (Axin2) and Nodal signalling (Nodal) in the Epiblast cluster, shown as normalized counts. (D) Schematic of directed differentiation towards antNPCs with signalling inhibitors added from day 2. (E) UMAP of integrated scRNA-seq samples collected at day 5. WT and Tet1 KO cells are either untreated or treated with 5 μM of the Wnt inhibitor XAV939 (XAV) or 2.5 μM of the Nodal signalling inhibitor SB431542 (SB). For clarity the UMAP is split per genotype and treatment. (F) UMAP clusters coloured by lineage identity. (G) Proportion of cell types annotated by lineage cluster per sample, using the colour scheme per lineage cluster shown in (F). (H) Selected top 10 differential regulons in Tet1 KO vs WT cells in Epiblast cluster ranked based on number of overlapping bulk RNAseq collated DEGs. (I) Expression level and regulon activity (number of genes in the regulon is indicated within the parenthesis) of Tcf7l1 in Epiblast cluster cells. (J) ChIP qPCR analysis of TET1 binding at Tcf7l1 transcription start site (TSS) at day 0 and day 2 of differentiation. Data are shown as mean ± SEM of n = 4 biological replicates, from two independent differentiations using two different ESC lines per genotype. (K) Gene expression of primitive streak markers T and Foxa2 at day 3 and day 5 of neurobasal differentiation (without inhibitor treatment) from Tet1 KO versus WT ESCs and Tcf7l1 KO vs WT R1 ESCs with a similar genetic background, measured using qPCR. Data are shown as mean ± SEM of n = 3 biological replicates from independent differentiations using two ESC lines of Tet1 KO and WT cells, and one ESC line of Tcf7l1 KO and R1 cells. (L) Heatmap of qPCR gene expression data of ectoderm (Sox1, Lhx5, Pax6), endoderm (Sox17, Spink1, Cpm) and mesoderm (Twist1, Myl7) lineage markers in Tet1 KO and Tcf7l1 KO ESCs vs their respective controls. Data are shown as Z-score of log10 transformed fold induction. (M) Western blot for TCF7L1 in serum + LIF-cultured ESCs treated for 48 h with 2 μg/ml doxycycline (DOX) to over express Tcf7l1 in Tet1 KO and WT stably transfected over-expression clonal lines. (N) Expression of primitive streak markers T and Foxa2 at day 3 of differentiation (without inhibitor treatment) from Tet1 KO and WT ESC lines overexpressing Tcf7l1. 2 μg/ml of DOX was added at day 1 or day 2. Data are shown as mean ± SEM of n = 6 biological replicates from two independent differentiations using three different ESC lines per genotype. (O) Wnt activity based on a transient transfection TOP/FOP-flash reporter assay measured at day 3 of differentiation in Tet1 KO and WT ESCs, treated with 2 μg/ml DOX from day 1 to over-express Tcf7l1. TOP-Flash contains a minimal fos-promoter coupled to Tcf-binding sites upstream of a luciferase reporter; FOP-Flash contains mutated Tcf-binding sites. Data are shown as mean ± SEM of n = 4 biological replicates using three different ESC lines per genotype.

