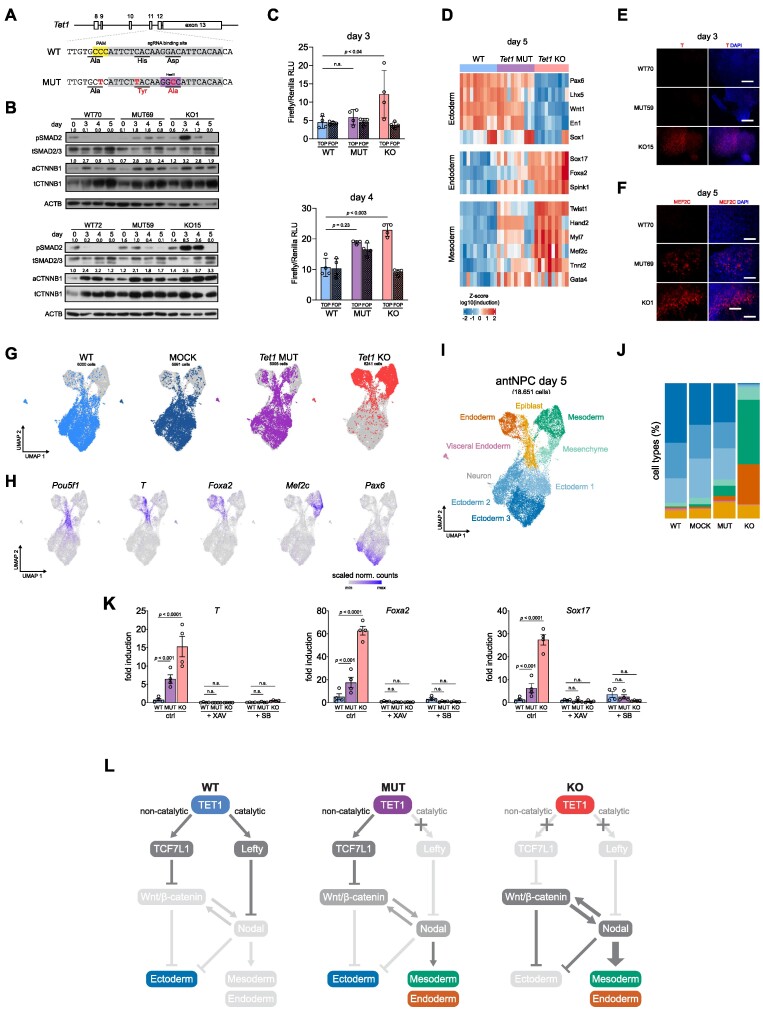
Figure 3.
Contribution of 5mC oxidation by TET1 in the repression of primitive streak fate. (A) Schematic of CRISPR-Cas9 target sequences to introduce mutations disrupting the catalytic activity of TET1 by homology directed repair. WT and mutant (MUT) sequences encoding the active site are indicated, with altered bases and amino acids in red. Guide RNA sequence is highlighted in grey, PAM site in yellow and the introduced restriction site used for genotyping in purple. (B) Western blot for phospho-(p)SMAD2 and active β catenin (aCTNNB1) as readouts of Nodal and Wnt signalling, respectively, at day 0 (ESC), 3, 4 and 5 of neurobasal differentiation (without inhibitors) using Tet1 KO, Tet1 mutant (MUT), and mock WT control cells. Two clonal ESC lines were examined per genotype. Bands are quantified and normalized to total protein (top band of tSMAD2/3 or tCTTNB1); normalized expression values are shown above each lane on the blot. (C) Wnt activity assay at day 3 and day 4 of differentiation using TOP/FOP-flash reporter. Data are shown as mean ± SEM of n = 4 biological replicates from two clonal ESC lines per genotype. (D) Heatmap of qPCR gene expression analysis of ectoderm (Pax 6, Lhx5, Wnt1, En1, Sox1), endoderm (Sox17, Foxa2, Spink1), and mesoderm (Twist1, Hand2, Myl7, Mef2c, Tnnt2, Gata4) lineage markers at day 5 of neurobasal differentiation. Data are shown as Z-score of log10 transformed fold induction, n = 8 using 3 clonal ESC lines per genotype in 4 independent differentiations. (E, F) Immunofluorescence staining of primitive streak marker protein T at day 3 (E) and mesoderm transcription factor MEF2C at day 5 (F) of differentiation. Scale bar indicates 100 μm. (G) UMAP of integrated scRNA-seq samples of Tet1 KO, MUT, mock WT control and WT cells collected at day 5. For clarity cells of each individual sample are coloured separately on the UMAP plots. (H) Expression levels of lineage markers projected on UMAP space as scaled normalized counts. (I) UMAP clusters at day 5 coloured by lineage identity. J) Proportion of cell types annotated by lineage cluster per sample at day 5. Colours correspond to lineage identities shown in (I). (K) Gene expression based on qPCR analysis of mesoderm (T) and endoderm markers (Foxa2 and Sox17) in Tet1 KO, MUT and WT cells at day 5 following treatment with 5 μM XAV, 2.5 μM SB or DMSO as vehicle control. Data are shown as mean ± SEM of n = 4 biological replicates from two clonal ESC lines per genotype. (L) Schematic of a bipartite mode of TET1 to regulate lineage bifurcation. In WT cells, both Wnt and Nodal signalling are repressed leading to ectoderm differentiation. In Tet1 KO, repression of Tcf7l1 and Lefty activates Wnt and Nodal signalling, respectively, leading to mesoderm and endoderm lineage specification. In Tet1 MUT cells, early activation of Nodal pathway is not sufficient to inhibit neuroectoderm differentiation. However, ‘leaky’ Nodal signalling induces Wnt signalling later in development, leading to all three lineages being present.

