Figure 6.
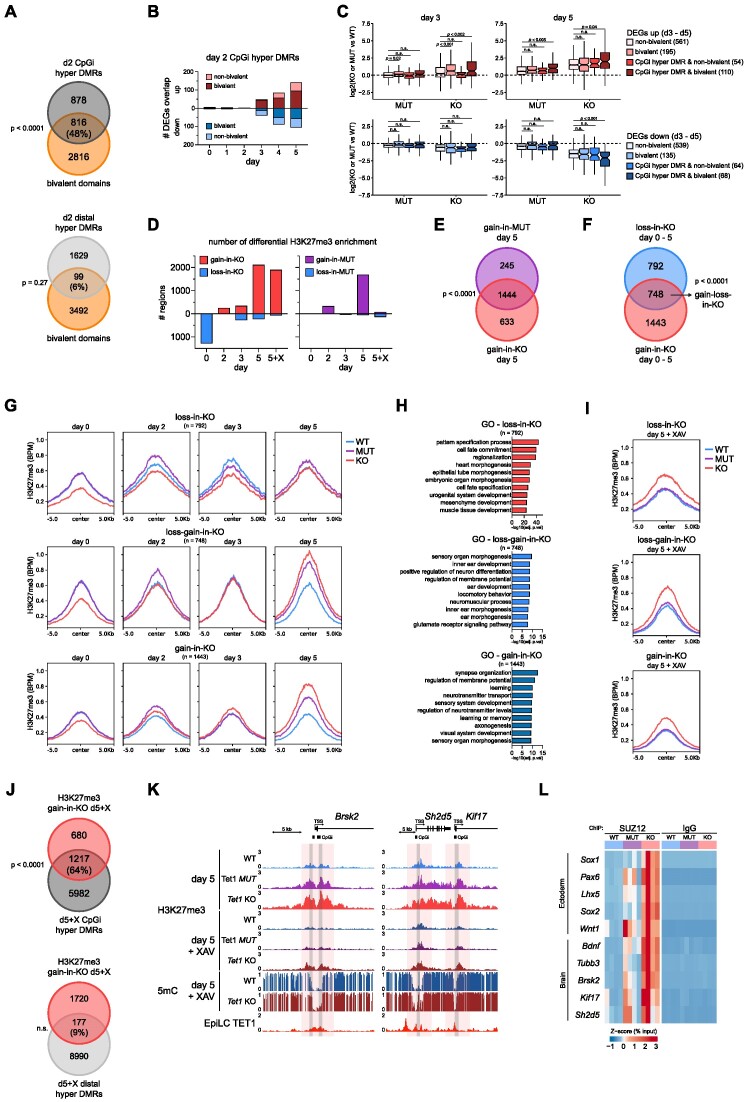
Functional interactions between TET1 and Polycomb at bivalent gene promoters. (A) Venn diagram of the association between bivalent domains and high-confidence TET1-dependent hyper DMRs at day 2, classified as CpGi-associated and distal DMRs. (B) Number of bulk RNA-seq DEGs (KO vs WT) per day of neurobasal differentiation (without inhibitors) that are within 10 kb of day 2 TET1-dependent hyper DMRs stratified based on bivalency and presence of a CpGi-associated hyper DMR. (C) Change in gene expression at day 3 or day 5 in Tet1 KO or MUT cells compared to WT cells for all unique DEGs collated from day 3 until day 5, stratified based on bivalency and presence of a TET1-dependent and CpGi-associated hyper DMR. (D) Number of differential H3K27me3 CUT&RUN peaks per day in KO versus WT and MUT versus WT comparisons. Day 5 samples were examined with (+X) or without XAV treatment. (E) Venn diagram of regions that gained H3K27me3 in Tet1 KO and MUT at day 5 of differentiation (without XAV) compared to WT. (F) Venn diagram of H3K27me3 loss-in-KO and gain-in-KO regions collated from day 0 to day 5. The overlap is described as H3K27me3 loss-gain-in-KO. (G) Profile plots of H3K27me3 CUT&RUN signal in BPM at loss-in-KO (top), loss-gain-in-KO (middle), and gain-in-KO regions (bottom) during the differentiation time-course in Tet1 KO, MUT, and WT cells. (H) Top 10 GO terms for genes associated with loss-in-KO, loss-gain-in-KO and gain-in-KO regions. (I) Profile plot of H3K27me3 CUT&RUN signal in BPM at day 5 (+XAV) loss-in-KO, loss-gain-in-KO and gain-in-KO. (J) Venn diagrams of H3K27me3 gain-in-KO regions and either CpGi-associated or distal hyper DMRs at day 5 (+XAV). (K) IGV tracks for H3K27me3 CUT&RUN signal in BPM at day 5 (±XAV), 5mC levels at day 5 (+XAV), and TET1 binding in EpiLCs at Brsk2, Sh2d5 and Kif17. Differential H3K27me3 gain-in-KO regions at day 5 (with or without XAV) are indicated in red, KO versus WT day 5 (+XAV) hyper DMRs are highlighted in grey. (L) Heatmap of SUZ12 ChIP-qPCR at loci where there is a significant increase of H3K27me3 in Tet1 KO and MUT at day 5, plotted as -log10(% input). Data are shown as mean ± SEM of n = 4, using two independent lines per genotype and 2 technical ChIP replicates per line. In the Venn overlap analyses of A, E and J, all promoters in the genome (n = 74 840) were used as background for a hypergeometric test.

