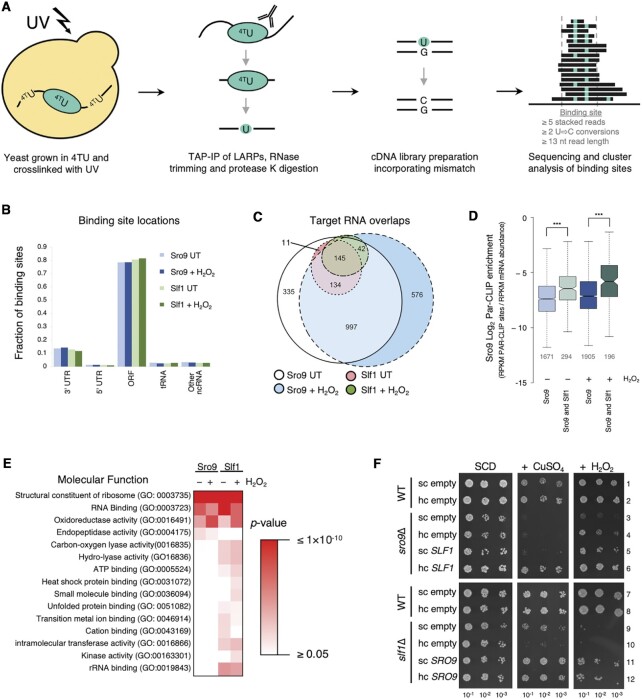
Figure 1.
Sro9 and Slf1 bind in mRNA coding regions. (A) Overview of PAR-CLIP protocol. (B) Distribution of Sro9 and Slf1 PAR-CLIP binding sites from 0.4 mM H2O2 treated or untreated (UT) yeast. Other ncRNA includes CUT, SUT, ncRNA, snRNA, snoRNA and rRNA. Shades of blue and green are used for Sro9 and Slf1, respectively with darker shades for H2O2 treated. (C) Overlap between target mRNAs identified in PAR-CLIP studies, segment numbers >5 are indicated. (D) PAR-CLIP enrichment of Sro9 targets. Enrichment of PAR-CLIP rpkm/RNA-Seq rpkm for each mRNA in a group, comparing all Sro9 targets and the subset also bound by Slf1. Boxes extend from 25–75% of the data range with notches around median. The notches are ±1.58 × interquartile range(IQR)/sqrt(n) and represent the 95% confidence interval for each median. Whiskers extend to data points that are less than 1.5 x IQR away from 1st/3rd quartile. The number of mRNAs in each group is given below each plot (grey). P-values are Mann–Whitney test (*** left to right = 4.273e–15, < 2.2e–16). All Sro9 colouring as in panel B, Slf1 shared genes have lighter shaded boxes. (E) Functional categorization. Sro9 and Slf1 bound transcript Go-slim ‘Molecular Function’ over-enriched terms either in the absence (−) or presence (+) of H2O2. P-values are Fisher's Exact test corrected for false discovery rate. (F) Phenotypic serial dilution growth assay complementation of deletion strain phenotypes with single copy (sc) or high copy (hc) plasmids. ‘empty’ denotes controls plasmids without SLF1 or SRO9. Growth medium is synthetic complete (SCD) with or without 2 mM CuSO4 or 1.8 mM H2O2. Top: wild-type (WT), sro9Δ and its complementation with SLF1. Bottom: WT, slf1Δ and its complementation with SRO9.

