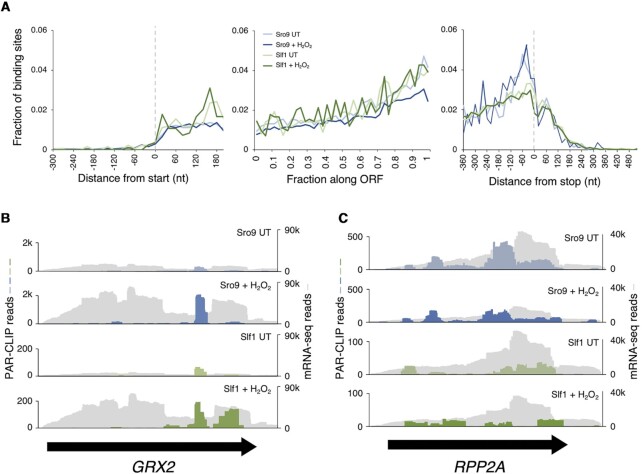
Figure 2.
Sro9 and Slf1 binding increases along ORFs. (A) Aggregate ‘metaplot’ of mRNA binding site distribution from PAR-CLIP relative to start codons (left), stop codon (right) measured in nucleotides (nt) and across the ORF (middle) where each ORF is compressed into 100 centiles for Sro9 and Slf1 from H2O2 treated or untreated (UT) yeast coloured as in Figure 1B. (B and C) PAR-CLIP coverage on example mRNAs: (B) GRX2 and (C) RPP2A. RNA-seq coverage in grey, PAR-CLIP coloured as in Figure 1B. Black arrows indicate the extent of each coding region.

