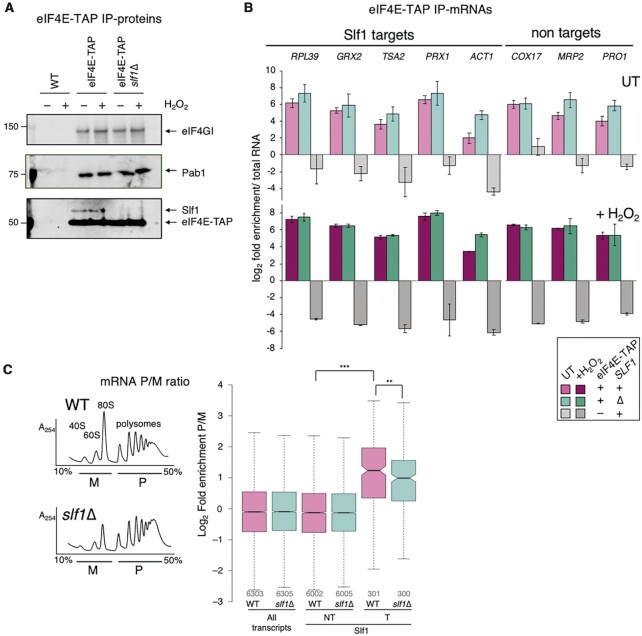
Figure 3.
No reduction in eIF4E-mRNA interactions in slf1Δ. (A) Western blots showing eIF4F factor association with eIF4E-TAP in the presence or absence of Slf1. (B) qRT-PCR of mRNAs associated with eIF4E-TAP ± Slf1 ± H2O2. ACT1 is in ‘Costello group I’, all other targets are in IIIA. Non-targets: group IVA (COX17, MRP2) or IVC (PRO1) (n = 3). Samples coloured as indicated in boxed key (magenta for WT and cyan for slf1Δ cells, with darker shades for ±H2O2). (C) Polysome profiles (A254 traces from 15–50% sucrose gradients) of extracts from wild-type (WT) and slf1Δ cells. Underlined areas marked monosome (M) and polysome (P) were pooled for mRNA-seq (n = 3). Right, Ratio of polysome:monosome association for indicated grouped mRNAs in wild-type (WT) and slf1Δ strains. Box plot parameters explained in legend to Figure 1, colours as panel B. P-values shown are *** < 2.2 × 10⁻¹⁶ and ** = 0.00350 (Mann–Whitney test).

