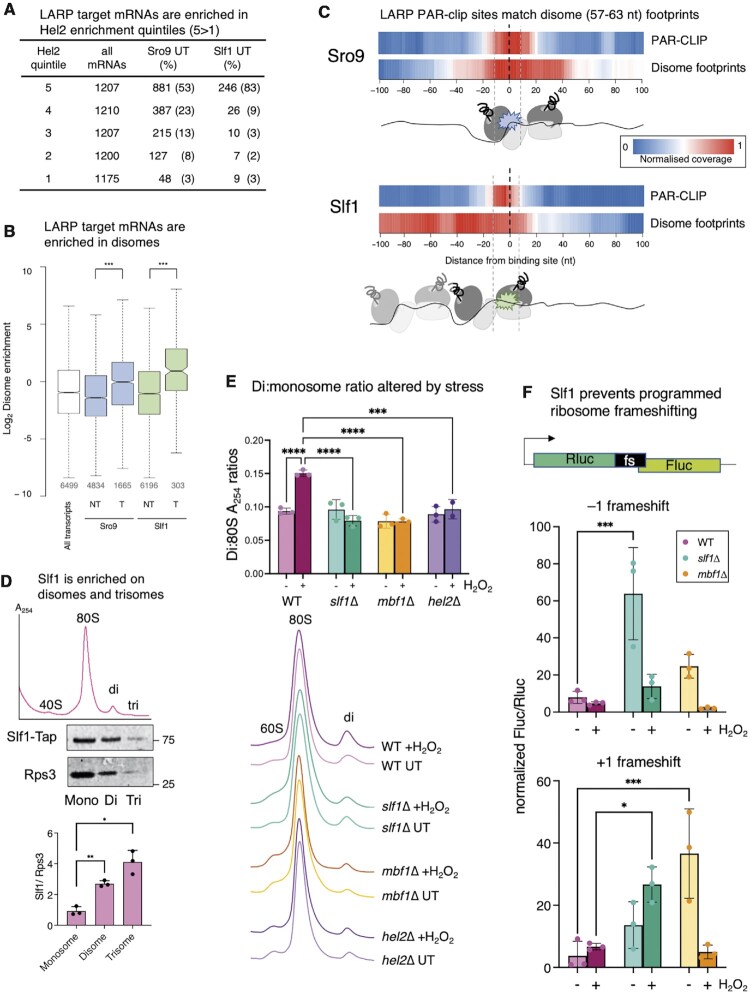
Figure 6.
LARPs are enriched on disomes. (A) Distribution of Sro9 and Slf1 targets among Hel2 quintiles grouped according to Hel2-CRAC read counts (1, the lowest; 5, highest Hel2 binding), as described (61). (B) LARP target mRNAs are enriched in disomes. More disomes are found on Slf1 and Sro9 targets than NT mRNAs. All P-values (***) < 2.2 × 10⁻¹⁶ (Mann–Whitney test). Box plot details as shown in Figure 1D. (C) Meta plot of disomes isolated from untreated cells (40) mapped to ± 100 nt of PAR-CLIP site mode locations. Cartooned enriched disome ribosome and Larp positions shown below (see also Supplementary figure S9). (D) Slf1 is enriched on disomes and trisomes. Labelled example sucrose density gradient trace of ribosomes from cell extract not cycloheximide treated (top). Western blots (middle) of collected mono-, di- and trisome fractions, and quantification (n = 3). Quantification assumes a single Slf1-binding site per disome/trisome, while two or three Rps3 subunits, respectively are counted. P-values two-tailed t-test, paired samples ** M:D 0.0015, *M:T 0.017. (E) RNase-treated sucrose grandient traces ±15 min peroxide stress, aligned and stacked. Above, quantification of the disome: monosome ratios for 3 biological replicates. Statistics are two-way ANOVA with Tukey post hoc multiple comparison test adjusted P values. All pairs indicated **** are < 0.0001, except hel2Δ versus WT where P= 0.0004. (F) DLR assays using programmed + 1 and –1 ribosome frameshifting reporter sequences normalised to frame 0 control values. Cells grown to mid-log ± 2 hour oxidative stress treatment (n = 3). Statistics are two-way ANOVA with Tukey multiple comparison correction among strains; –1 frameshift: *** = 0.0001, +1 frameshift: *** = 0.0004, * = 0.0153.

