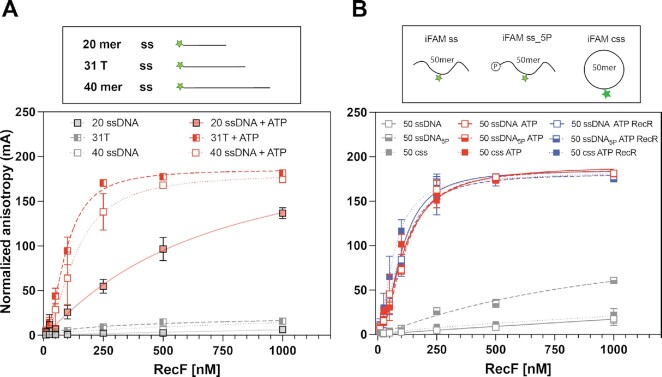
Figure 3.
RecF binding to ssDNA(s); length effect. The RecF binding to ssDNA varying in length was tested by fluorescence anisotropy. The values represent the mean of reactions carried out in triplicate and the standard deviation obtained for each RecF concentration. The curves represent the Hill slope binding model obtained for each condition. (A) RecF binding to 20 (filled square, solid line), 31 (half-filled square, dashed line) and 40mer (empty square, dotted line) ssDNA FAM labeled on the 5′ end was tested was tested either in the absence (grey) or in presence of 3 mM ATP (red). For the 20mer, the values used were the same in Figure 1 and are presented with 50% transparency. (B) RecF binding to 50mer ssDNA substrates non phosphorylated (open square, solid line), 5′ phosphorylated (half-filled square, dashed line) and circularized (filled square, dotted line) was tested in absence of co-factors (grey), in presence of 3 mM ATP (red) or in presence of 3 mM ATP and 5 μM of RecR (black).

