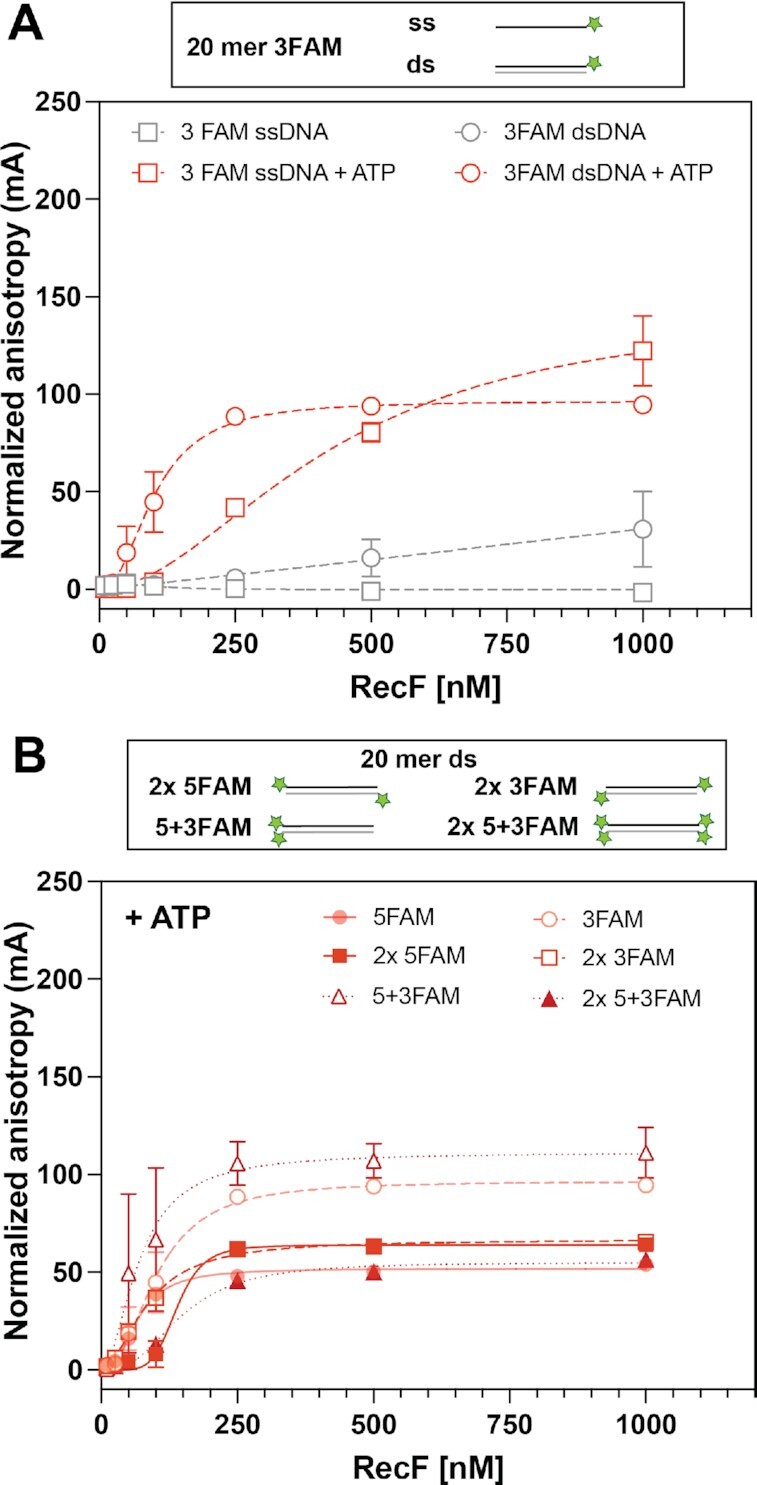
Figure 4.

Effect of DNA end FAM labels. RecF bnding to 20mer DNA substrates presenting variation in their FAM labelling orientation was tested by fluorescence anisotropy. The values plotted represent the mean of reactions carried out in triplicate and the standard deviation obtained for each RecF concentration. The curves represent the Hill slope binding model obtained for each condition. (A) RecF binding to 3FAM ssDNA (empty square), or dsDNA (empty circle) was tested in absence (grey), or in presence of 3 mM ATP (red). (B) RecF binding to dsDNA substrate presenting several ends FAM labelled, i.e. 2 × 5FAM (filled square; solid line), 2 × 3FAM (open square, dashed line), two FAM labels on the same DNA end called 5 + 3FAM (open triangle, dotted line) and 2 FAM labels on both ends (filled triangles; dotted line) were carried out in the presence of 3 mM ATP. Binding curves of multiple labeled DNA are compared to the curves previously obtained for the singly labeled versions (from Figures 1 and 4A) presented with 50% transparency.
