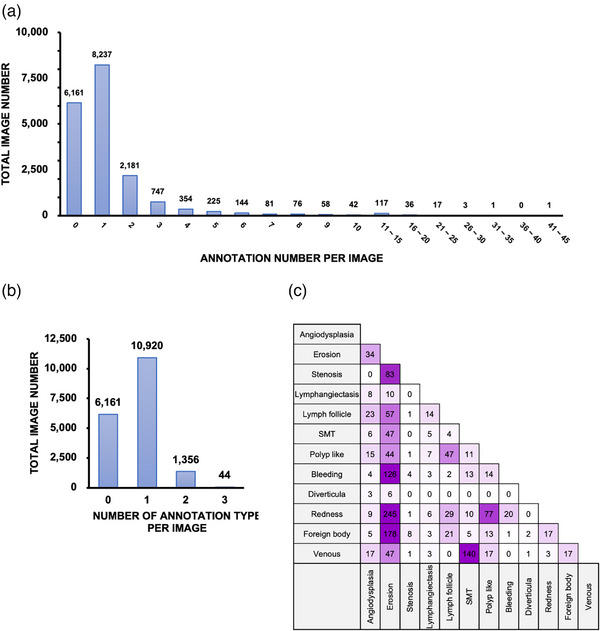
FIGURE 3.

Features of annotations in the dataset. (a) Distribution of annotation labels per image and 4083 of 18,481 images have multiple lesions in one image. Approximately 2% of all images contained more than 10 annotation labels. (b) Distribution of annotation label types per image. There are two different abnormalities in 1356 images and three types in 44 images. (c) The number of annotation labels appears in the same image; for example, “erosion” and “redness” both tended to appear more often with other annotation label types.
