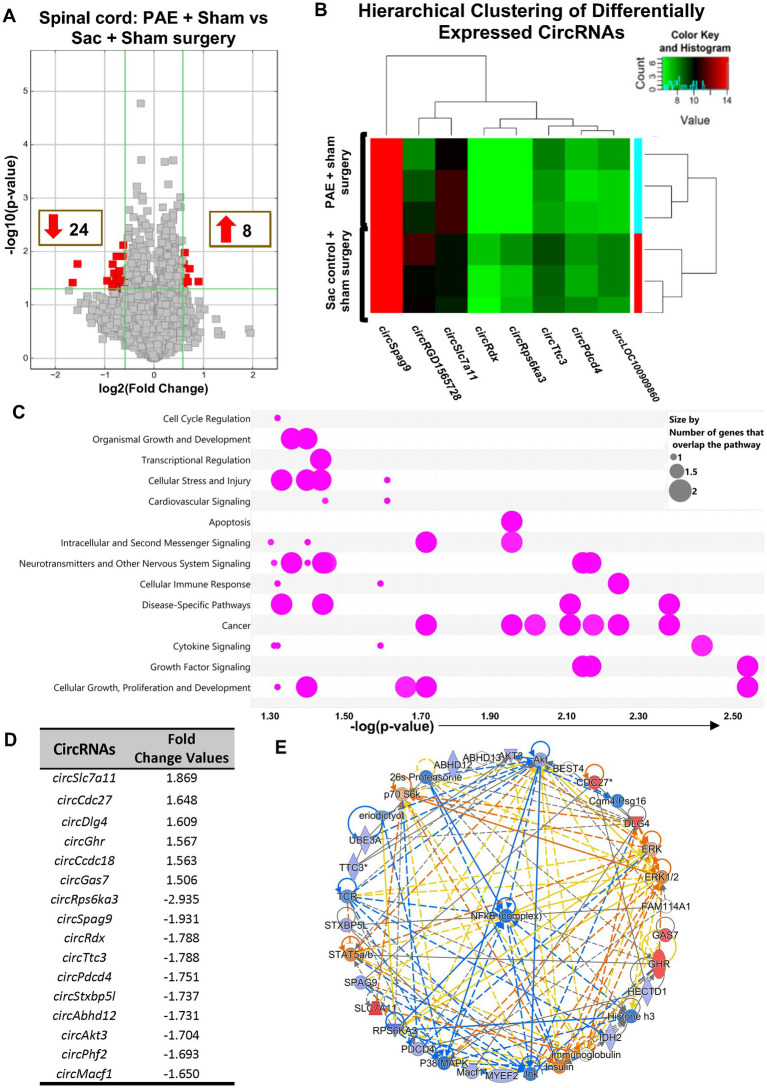
Figure 2.
PAE results in altered spinal circRNAs from genes related to the proinflammatory transcription factor NF-κB in the absence of chronic neuropathy. (A) Volcano plots displaying differentially expressed circRNAs between PAE and Sac spinal cord, without nerve injury. X-axis represents log2 fold change (dotted line = 1.5-fold), Y-axis represents −log10 p-value (dotted line: p = 0.05). The red points in the plot represent the differentially expressed (both upregulated and downregulated) circRNAs with 1.5-fold changes (p < 0.05). (B) Heat map of the circRNA microarray profiles (selected for fold changes of 1.75 or more) in the PAE + Sham surgery and Sac control + Sham surgery groups. The expression of circRNAs is hierarchically clustered on FIGURE 2 (Continued)the Y-axis, and spinal cord biological replicates from these two groups are hierarchically clustered on the X-axis. Green and red represent lower higher expression levels of the circRNAs, respectively. (C) Ingenuity Pathway Analysis (IPA) of host genes associated with differentially expressed circRNAs. The bubble chart plots the pathway categories (Y-axis) related to these genes vs. the negative log of the p-values (X-axis), the smaller the p-values (a larger −log of that value) indicates a more significant association. This plot demonstrates the major functional categories of various associated canonical signaling pathways (as indicated by bubbles) regulating critical functions such as cell cycle regulation, cellular stress and injury, neurotransmitters and other nervous system signaling, and cytokine signaling, amongst many more. The associations with signaling pathways are selected for IPA analysis (pink color), the size refers to the number of genes that overlap with a pathway. (D) Top upregulated and downregulated circRNAs, parental or host gene symbol and fold changes, the absolute ratio of normalized intensities between two conditions. (E) The comprehensive molecular networks are generated using IPA Canonical Pathways’ top network function. The network comparing PAE to the control group in the spinal cord is generated from the primary top network (z-score = 47). Molecules in blue and red are downregulated and upregulated, respectively. Three different biological replicates (each sample pooled from 2 to 3 rats per group, from Figure 1) per treatment group were used to generate the circRNA microarray data.

