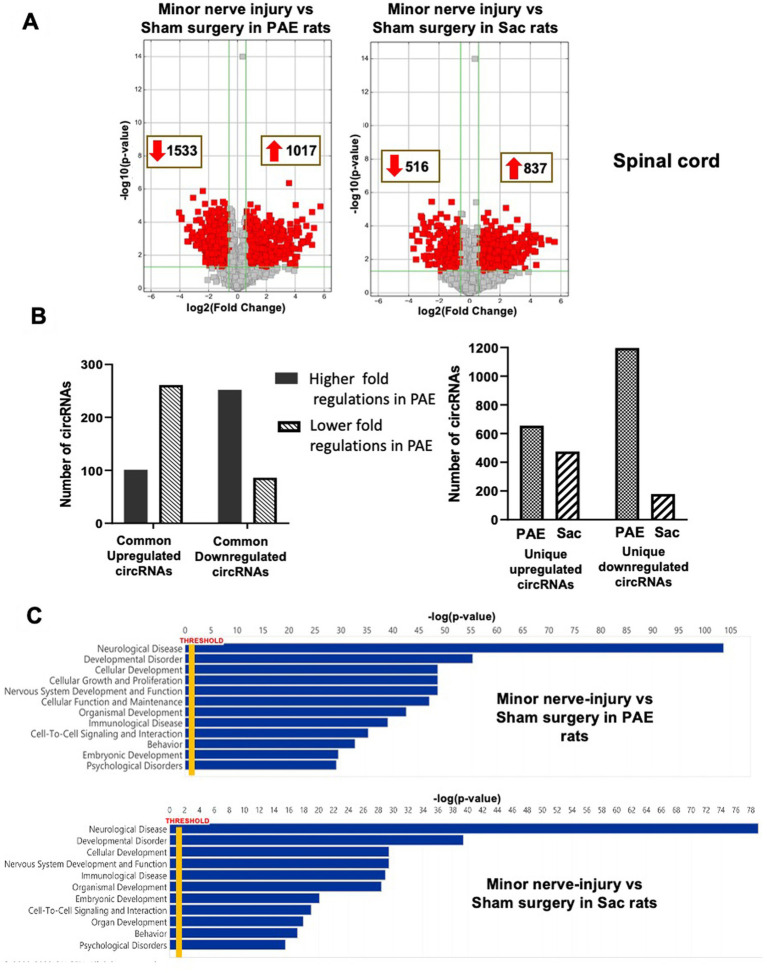
Figure 3.
PAE differentially modulates spinal circRNA expression following a minor nerve injury. (A) Volcano plots of differentially expressed circRNAs between nerve-injured PAE and Sac spinal cord, compared to their corresponding control tissues. X-axis represents log2 fold change (dotted line = 1.5-fold), Y-axis represents –log10 p-value (dotted line: p = 0.05). The red points in the plot represent the differentially expressed circRNAs, with 1.5-fold changes (p < 0.05). (B) The bar graphs represent the number of differentially expressed circRNAs as a result of injury, that are common or unique in PAE and Sac control rats. Among the altered circRNAs that are common in Sac control and PAE rats, the numbers of circRNAs that are further up or down-regulated in PAE conditions as a result of nerve injury are shown. (C) Ingenuity Pathway Analysis (IPA) from the host genes of the differentially expressed circRNAs is used to generate the list of associated diseases or functions (Y-axis) with associated −log p-values (X-axis).

