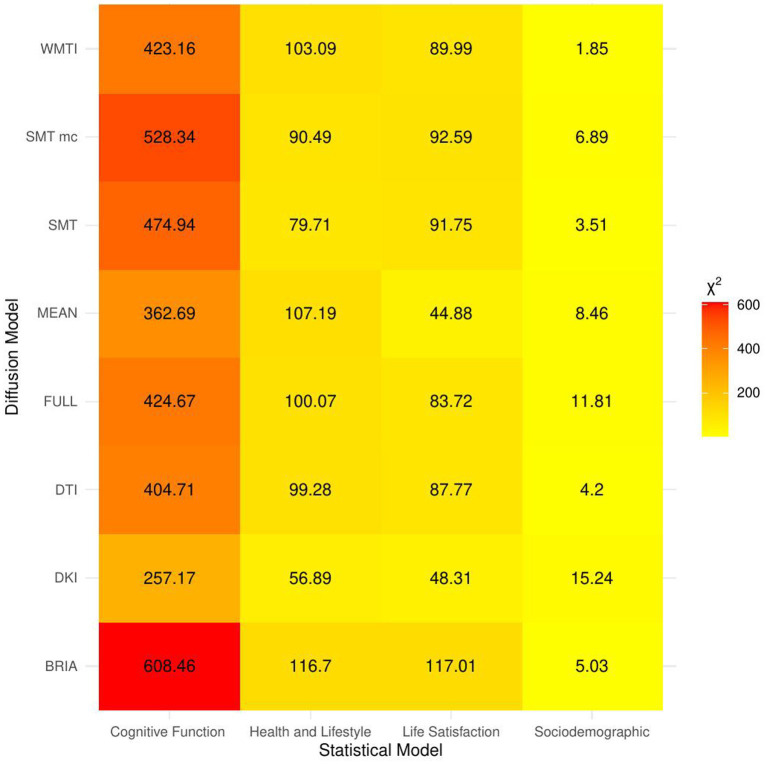
Figure 3.
Overview of comparison of bio-psycho-social statistical models with baseline models. The figure presents χ2 values for each of the bio-psycho-social statistical models for each diffusion approach tested against the baseline model. Note that only values of χ2 > 11 were significant (p < 0.05).

