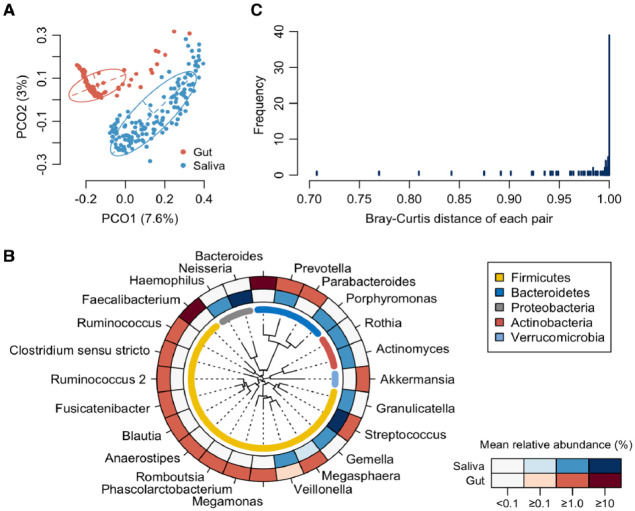
Figure 1.
Comparison of salivary and gut microbiota composition. (A) Principal coordinate analysis plot of saliva and stool samples using the Bray–Curtis distance based on amplicon sequence variant abundances. The bacterial composition of saliva and stool samples is depicted using different colors. The intersection of the broken lines indicates the center of gravity for each group. The ellipse covers 67% of the samples belonging to each group. (B) Mean relative abundance of predominant genera. Twenty-four genera with ≥1% of mean relative abundance in either salivary or gut microbiota are ordered according to a phylogenetic tree. The mean relative abundance of each genus is shown by the color intensity. (C) Histogram of the Bray-Curtis distance between paired saliva and stool samples for each subject.

